| Action | MMA | MACD_MME | Bollinger | Stochastique | RSI | Chandelier |
|---|---|---|---|---|---|---|
| ANSYS | RAS | RAS | RAS | Sur-achat↓ | Signal ↓↓ : -15.7% | Neutre | RAS |
ANSYS : 374.3
| 1j | 5j | 1m | 3m | 1a |
|---|---|---|---|---|
| 0% | 0% | 0% | 0% | 0% |
Evolution annuelle
Min : 374.3Moy : 374.3Max : 374.3
|
374.3
| Court terme | Moyen terme | Long terme |
|---|---|---|
 | | |


Analyse Boursicot du 18/09/2025
Graphique boursier
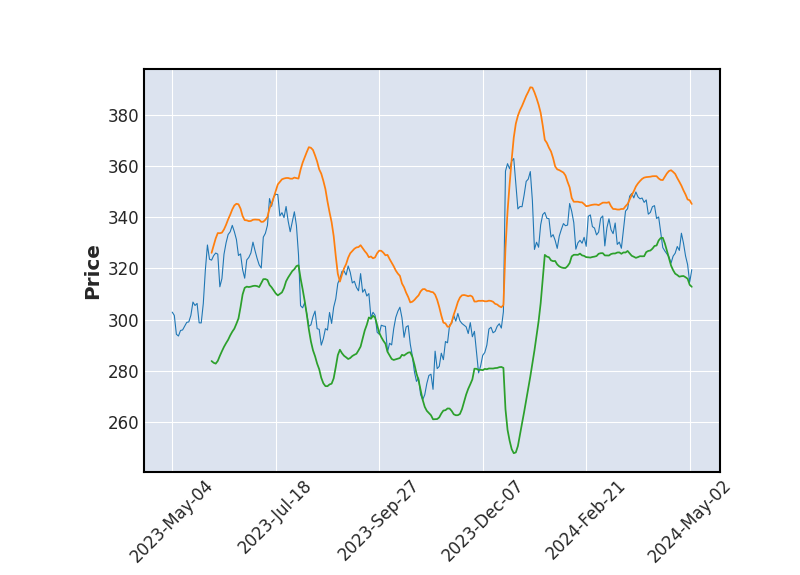 Bollinger
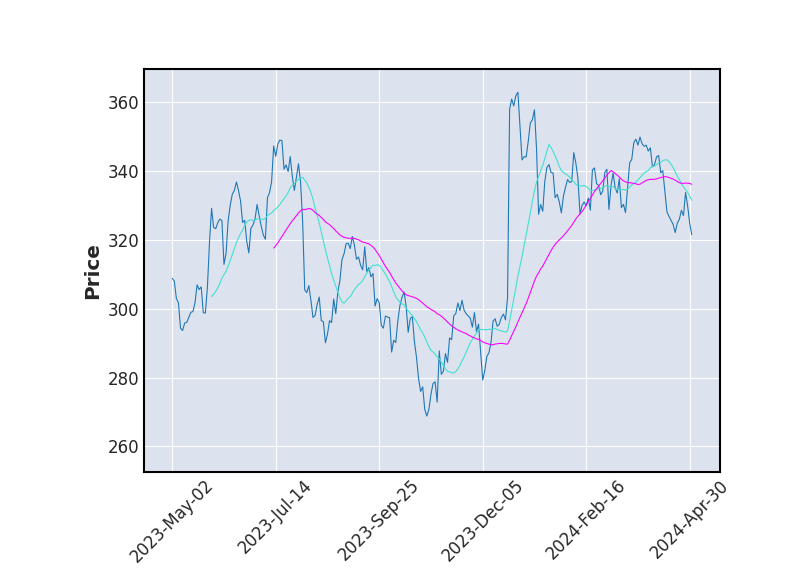 Moyenne Mobile
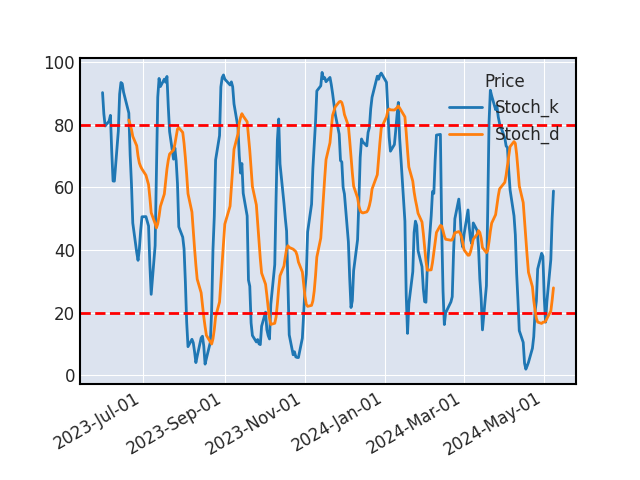 Stochastique
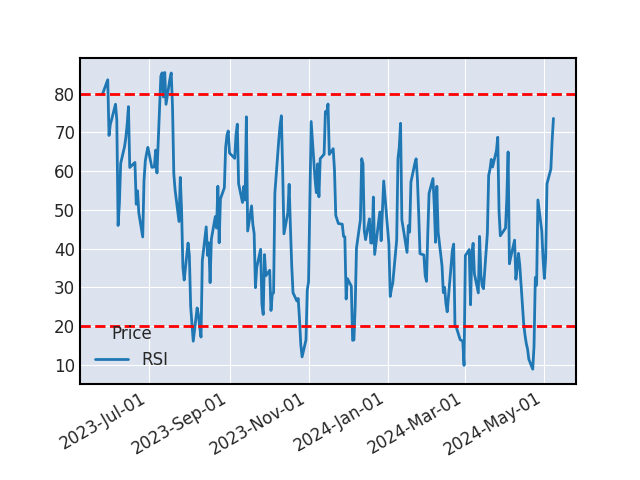 RSI
RSISTOCHASTIQUE
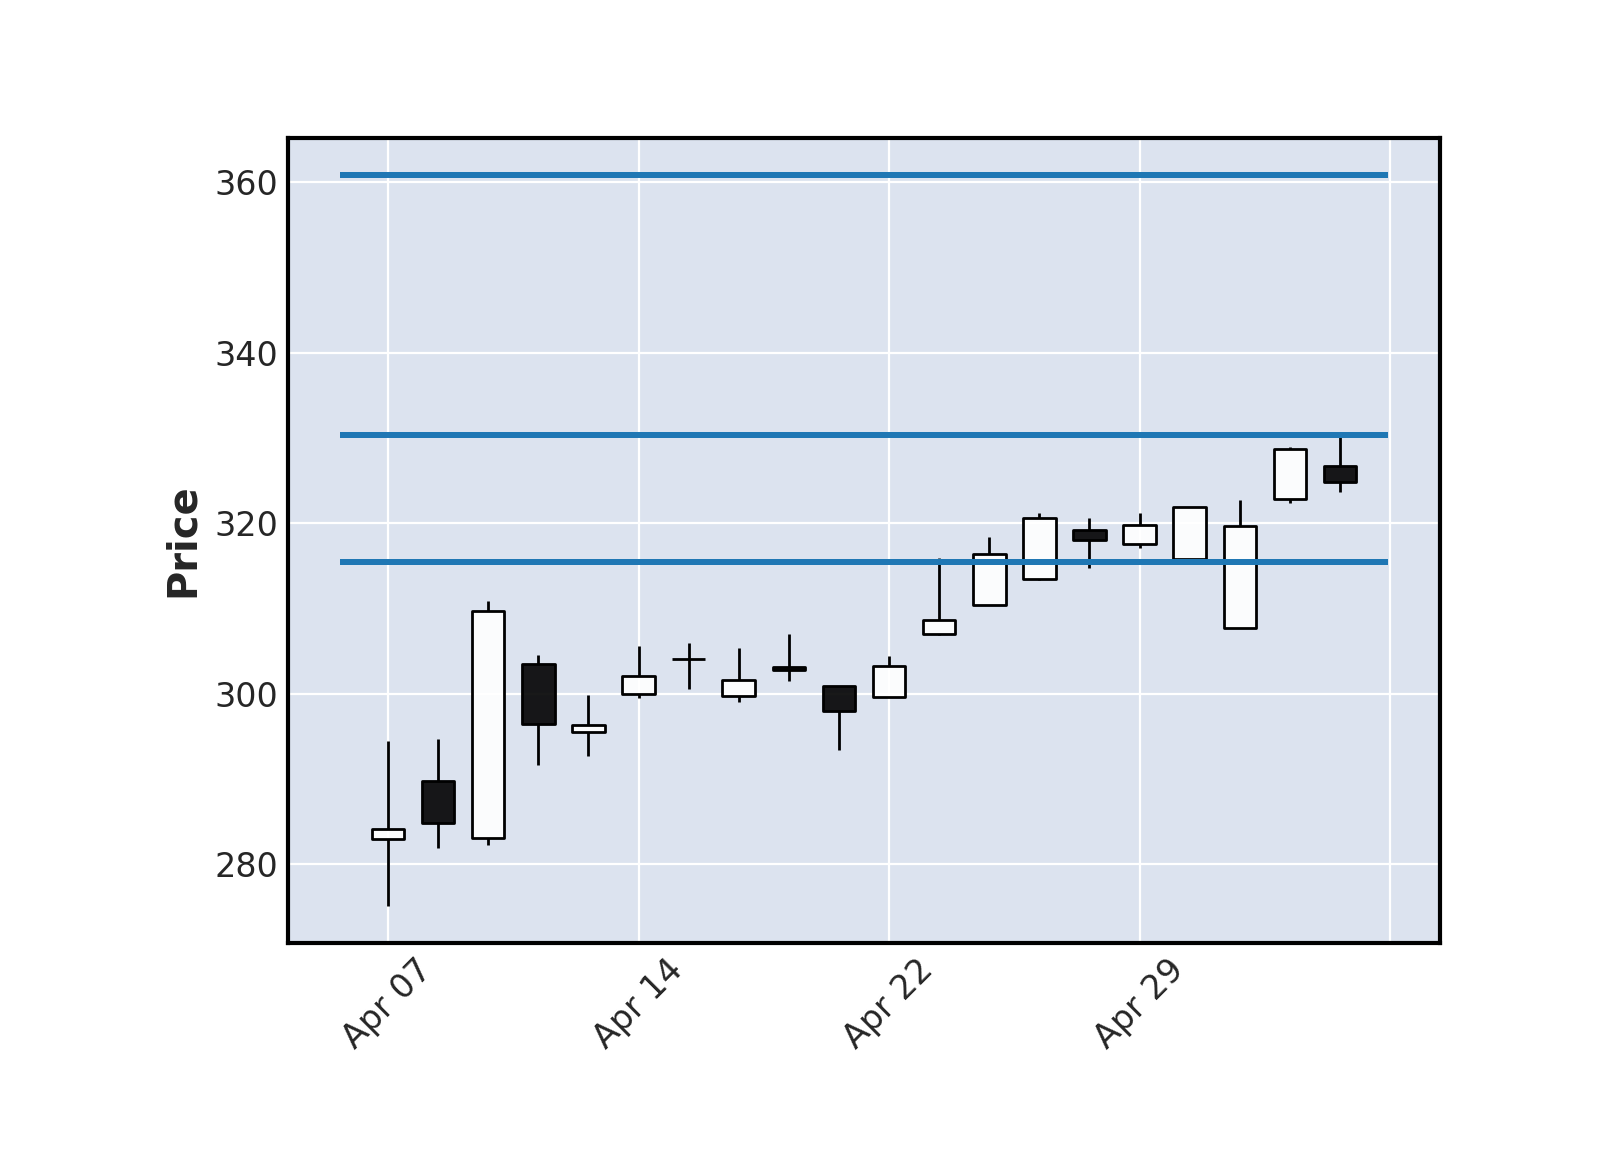
Le stochastique vient de franchir à la baisse la limite des 80 (zone de sur-achat), constituant un signal de baisse sur le cours ANSYS. Le croisement du stochastique et de son signal indique, si il est confirmé par d’autre indicateur, une baisse à venir sur le titre.
SUPPORTS ET RESISTANCES
| Support Résistance | Rebond | Ecart avec le cours |
|---|---|---|
| 360.9 | 2 | -3.58% |
| 346.43 | 4 | -7.45% |
| 334.09 | 6 | -10.74% |
| 325.91 | 3 | -12.93% |
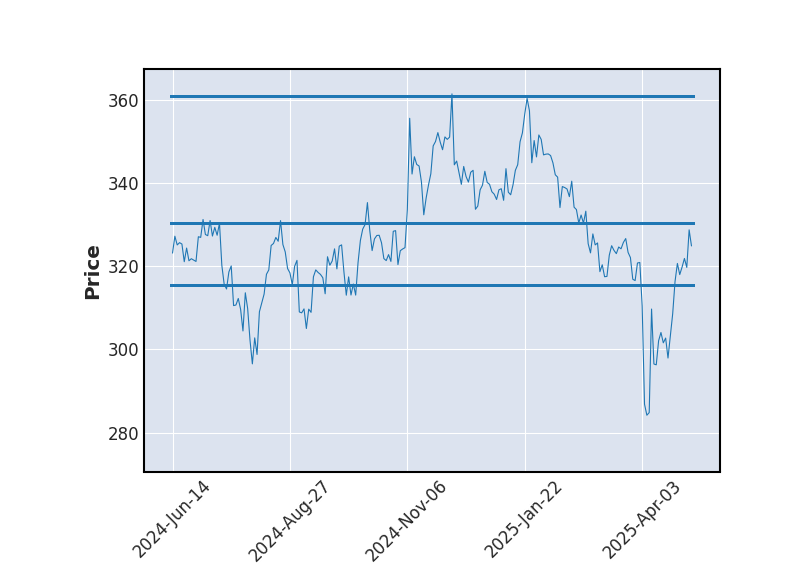
Historique de cours - ANSYS
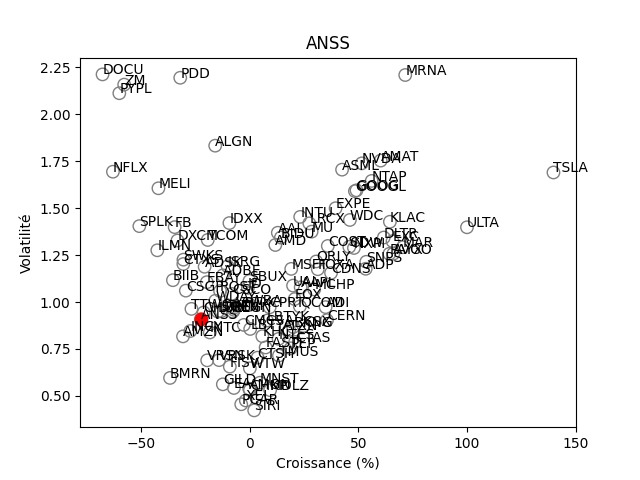
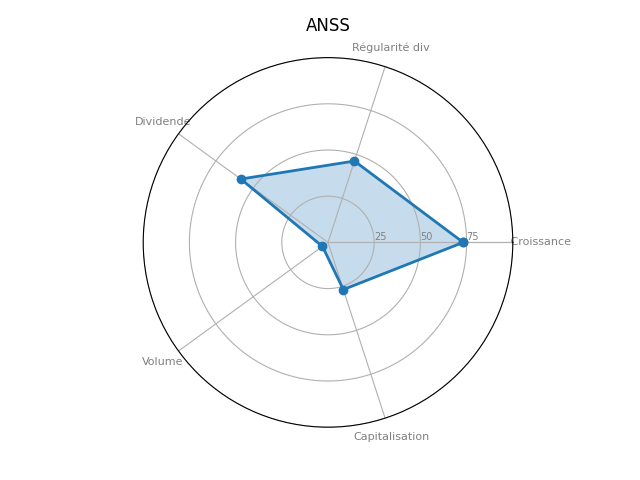
Positionnement boursier de ANSYS
Version Beta