| Action | MMA | MACD_MME | Bollinger | Stochastique | RSI | Chandelier |
|---|---|---|---|---|---|---|
| BAIDU | RAS | RAS | RAS | Neutre | RAS | Neutre | RAS |
BAIDU : 135.25
| 1j | 5j | 1m | 3m | 1a |
|---|---|---|---|---|
| -1.87% | 0% | 0% | 0% | 62.99% |
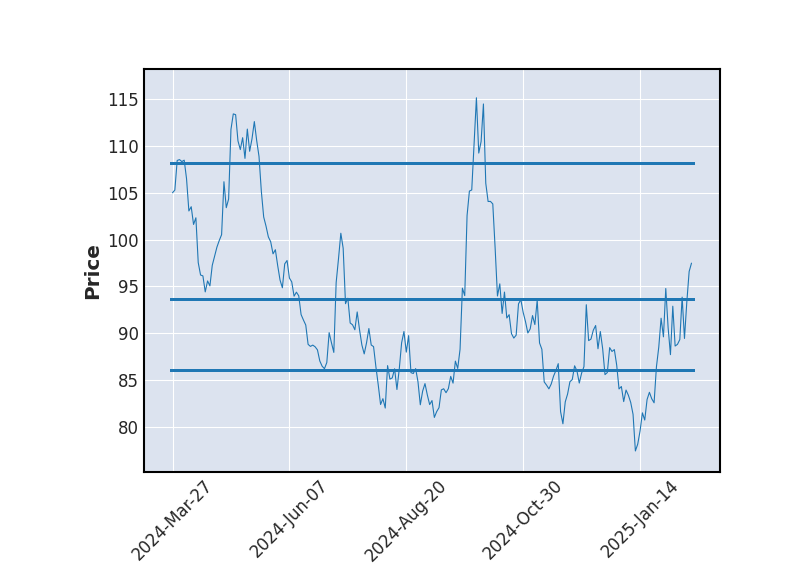
Evolution annuelle
Min : 81.17Moy : 90.8Max : 138
|
135.25
| Court terme | Moyen terme | Long terme |
|---|---|---|
 | | |


Analyse Boursicot du 18/09/2025
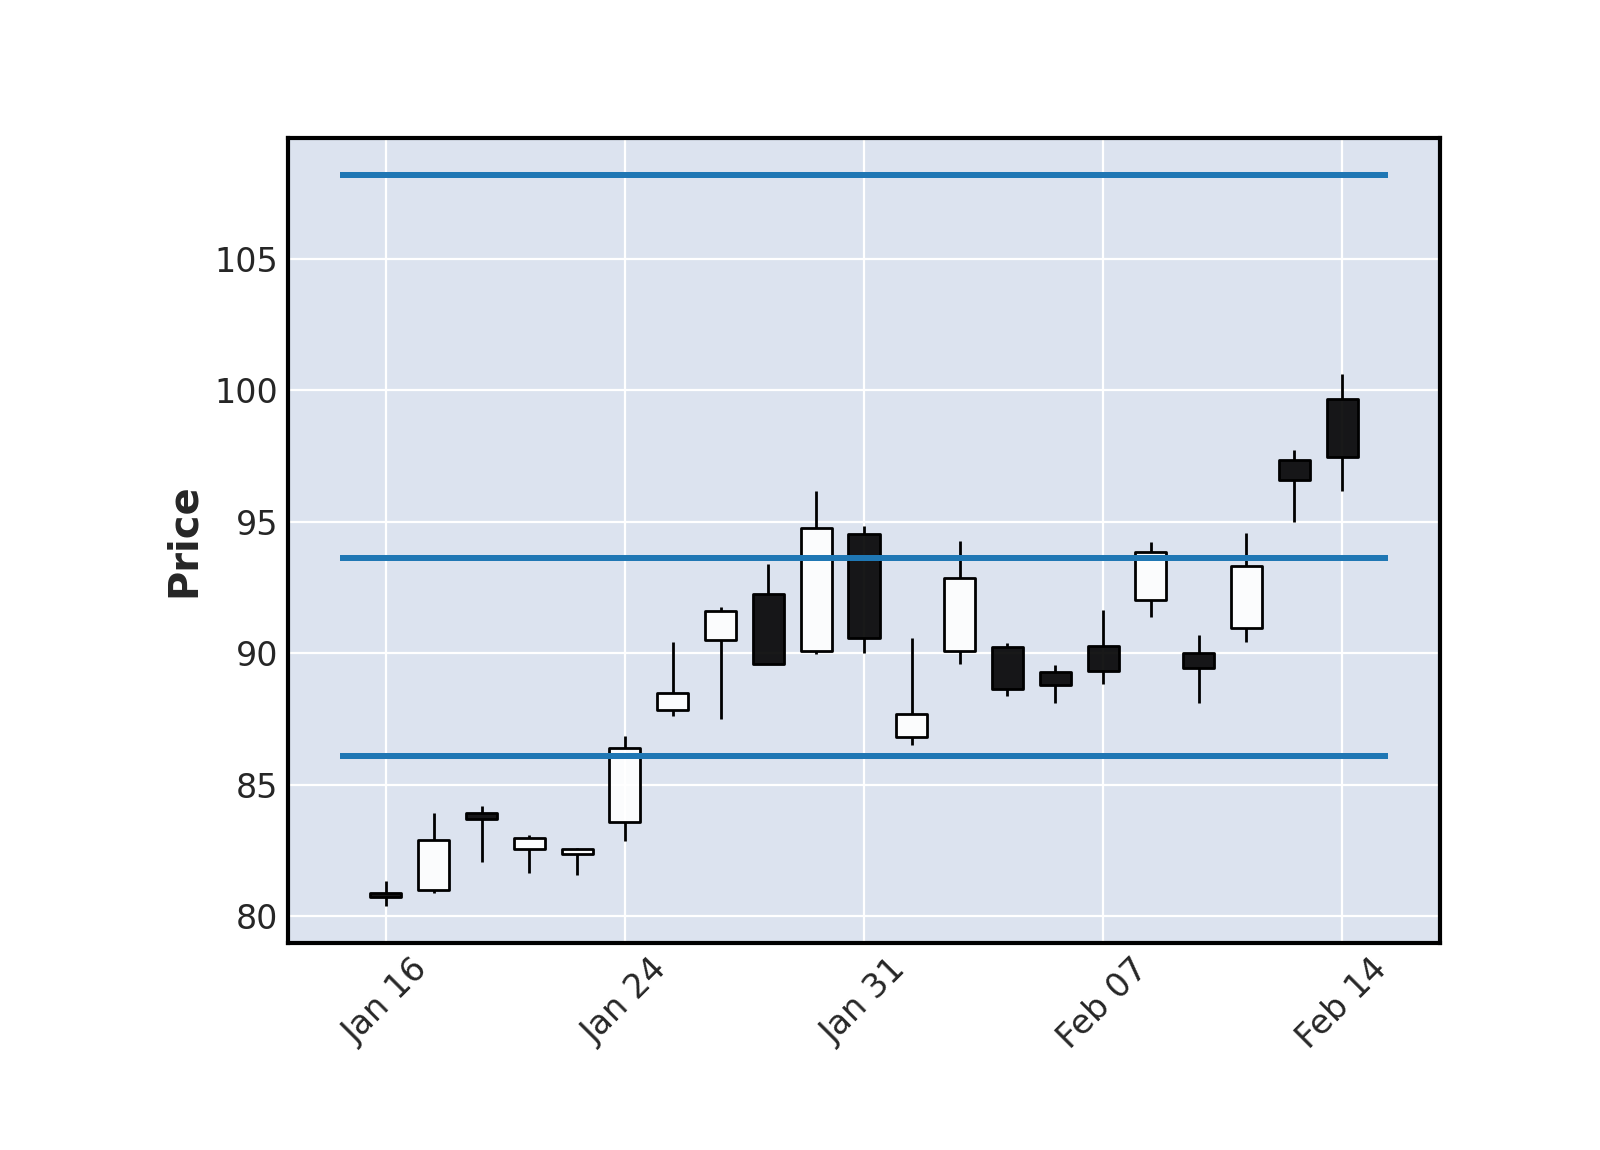
Graphique boursier
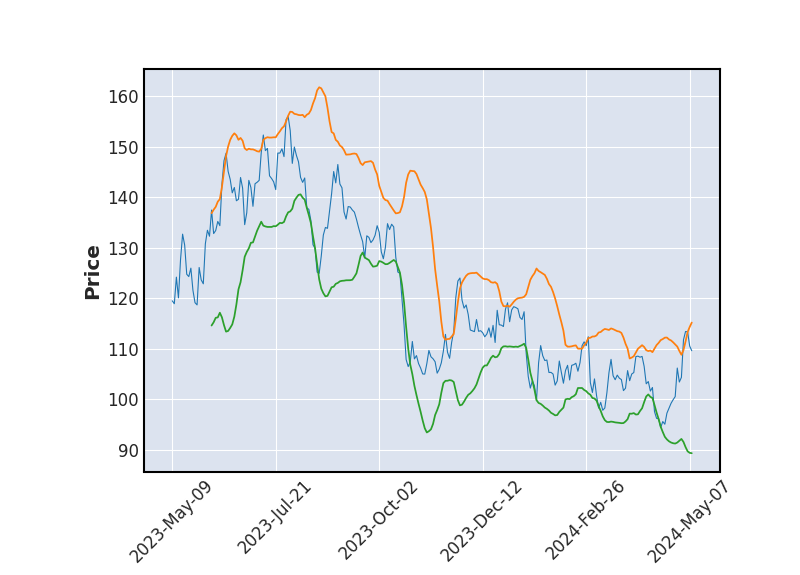 Bollinger
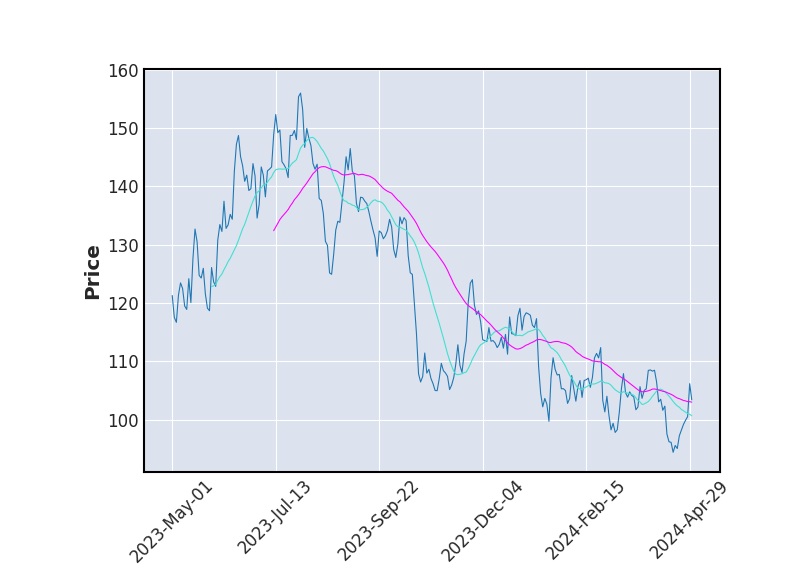 Moyenne Mobile
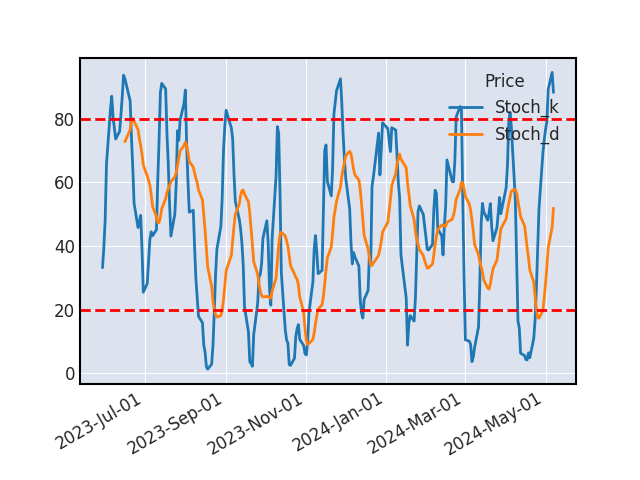 Stochastique
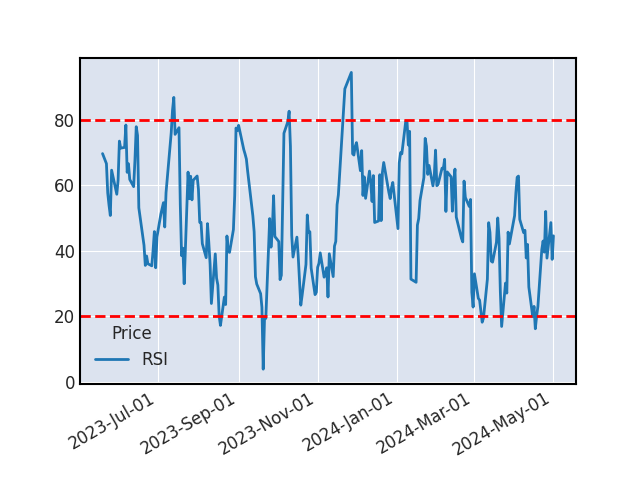 RSI
RSILe titre ne donne aucun signal d'achat ou de vente.
VOLUME
Les échanges sont très étoffés aujourd'hui, le mouvement est fort.
SUPPORTS ET RESISTANCES
| Support Résistance | Rebond | Ecart avec le cours |
|---|---|---|
| 93.09 | 6 | -31.17% |
| 86.0 | 7 | -36.41% |
Historique de cours - BAIDU
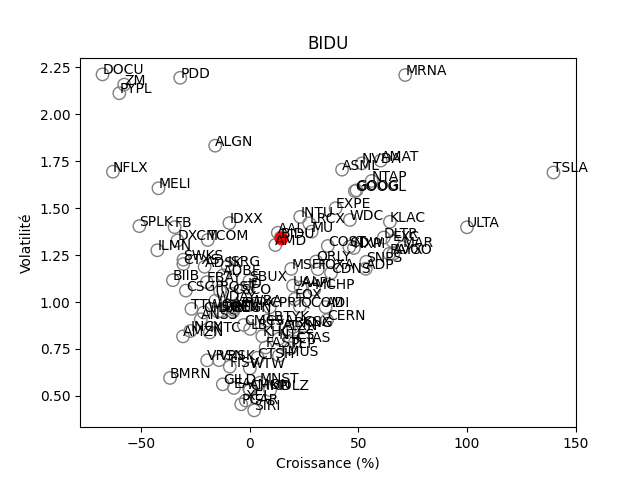
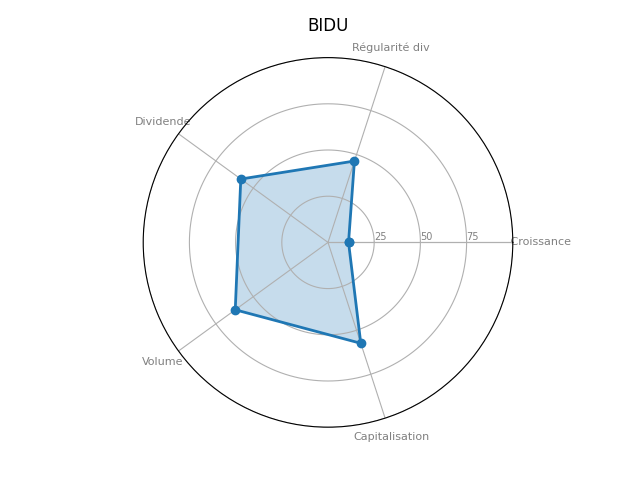
Positionnement boursier de BAIDU
Version Beta