| Action | MMA | MACD_MME | Bollinger | Stochastique | RSI | Chandelier |
|---|---|---|---|---|---|---|
| DEXCOM | RAS | RAS | RAS | Neutre | RAS | Neutre | RAS |
DEXCOM : 75.78
| 1j | 5j | 1m | 3m | 1a |
|---|---|---|---|---|
| -0.86% | 0% | 0% | 0% | -10.89% |
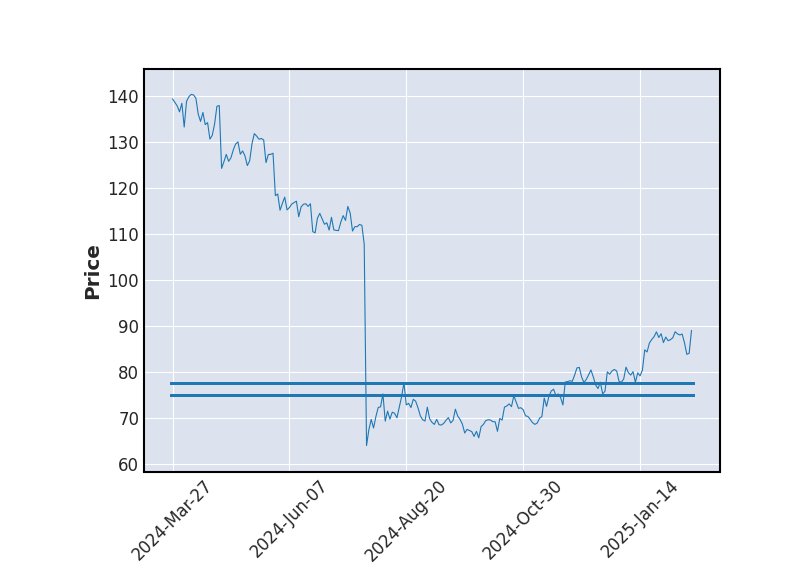
Evolution annuelle
Min : 71.8Moy : 80.98Max : 89.98
|
75.78
| Court terme | Moyen terme | Long terme |
|---|---|---|
 | |  |


Analyse Boursicot du 18/09/2025
Graphique boursier
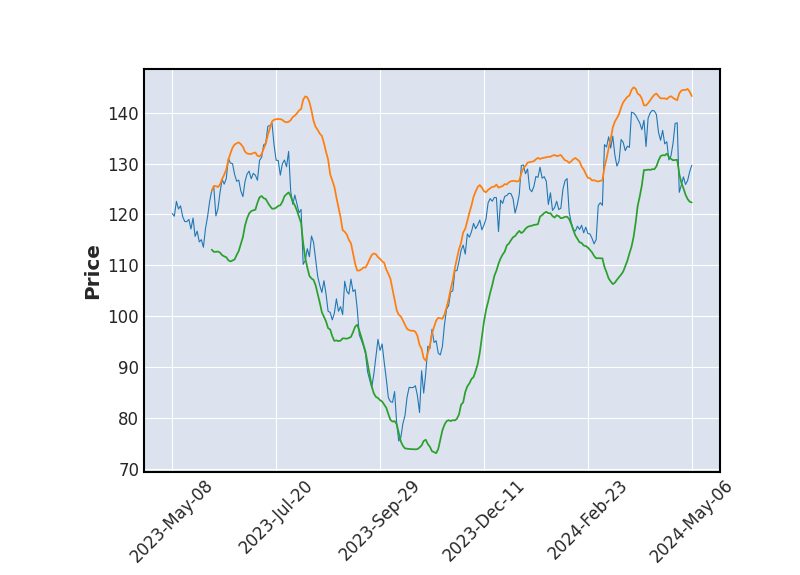 Bollinger
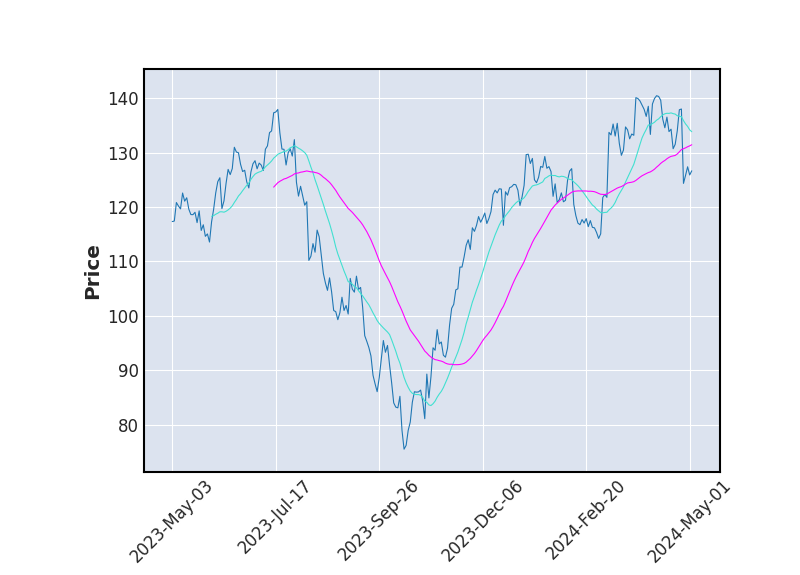 Moyenne Mobile
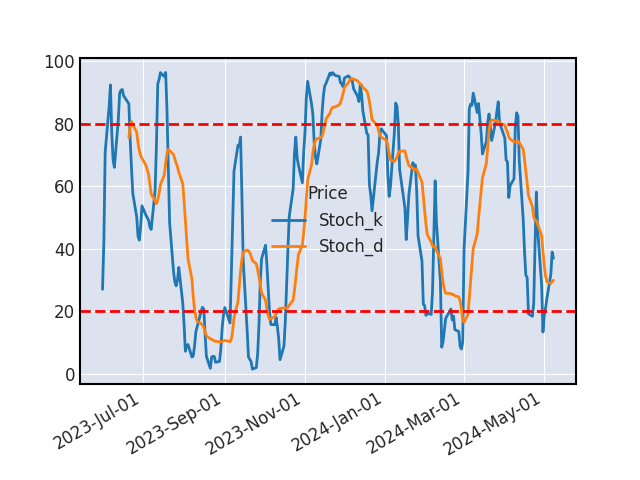 Stochastique
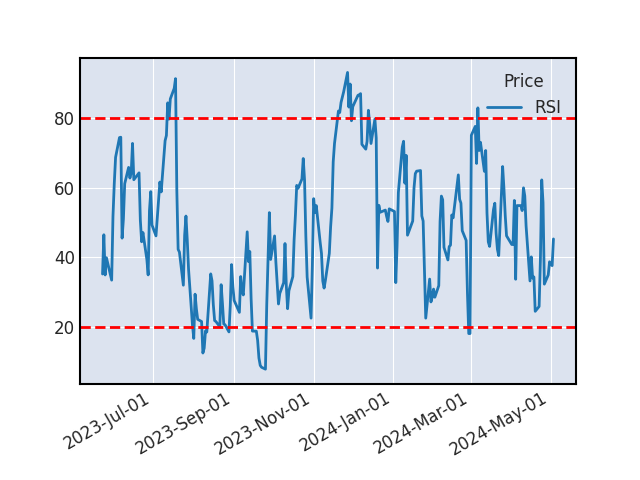 RSI
RSIAucun indicateur ne laisse présager d'une hausse ou d'une baisse à venir.
VOLUME
Les volumes échangés sur le titre DEXCOM sont particulièrement fort aujourdhui (plus de 50% au-dessus de la moyenne).
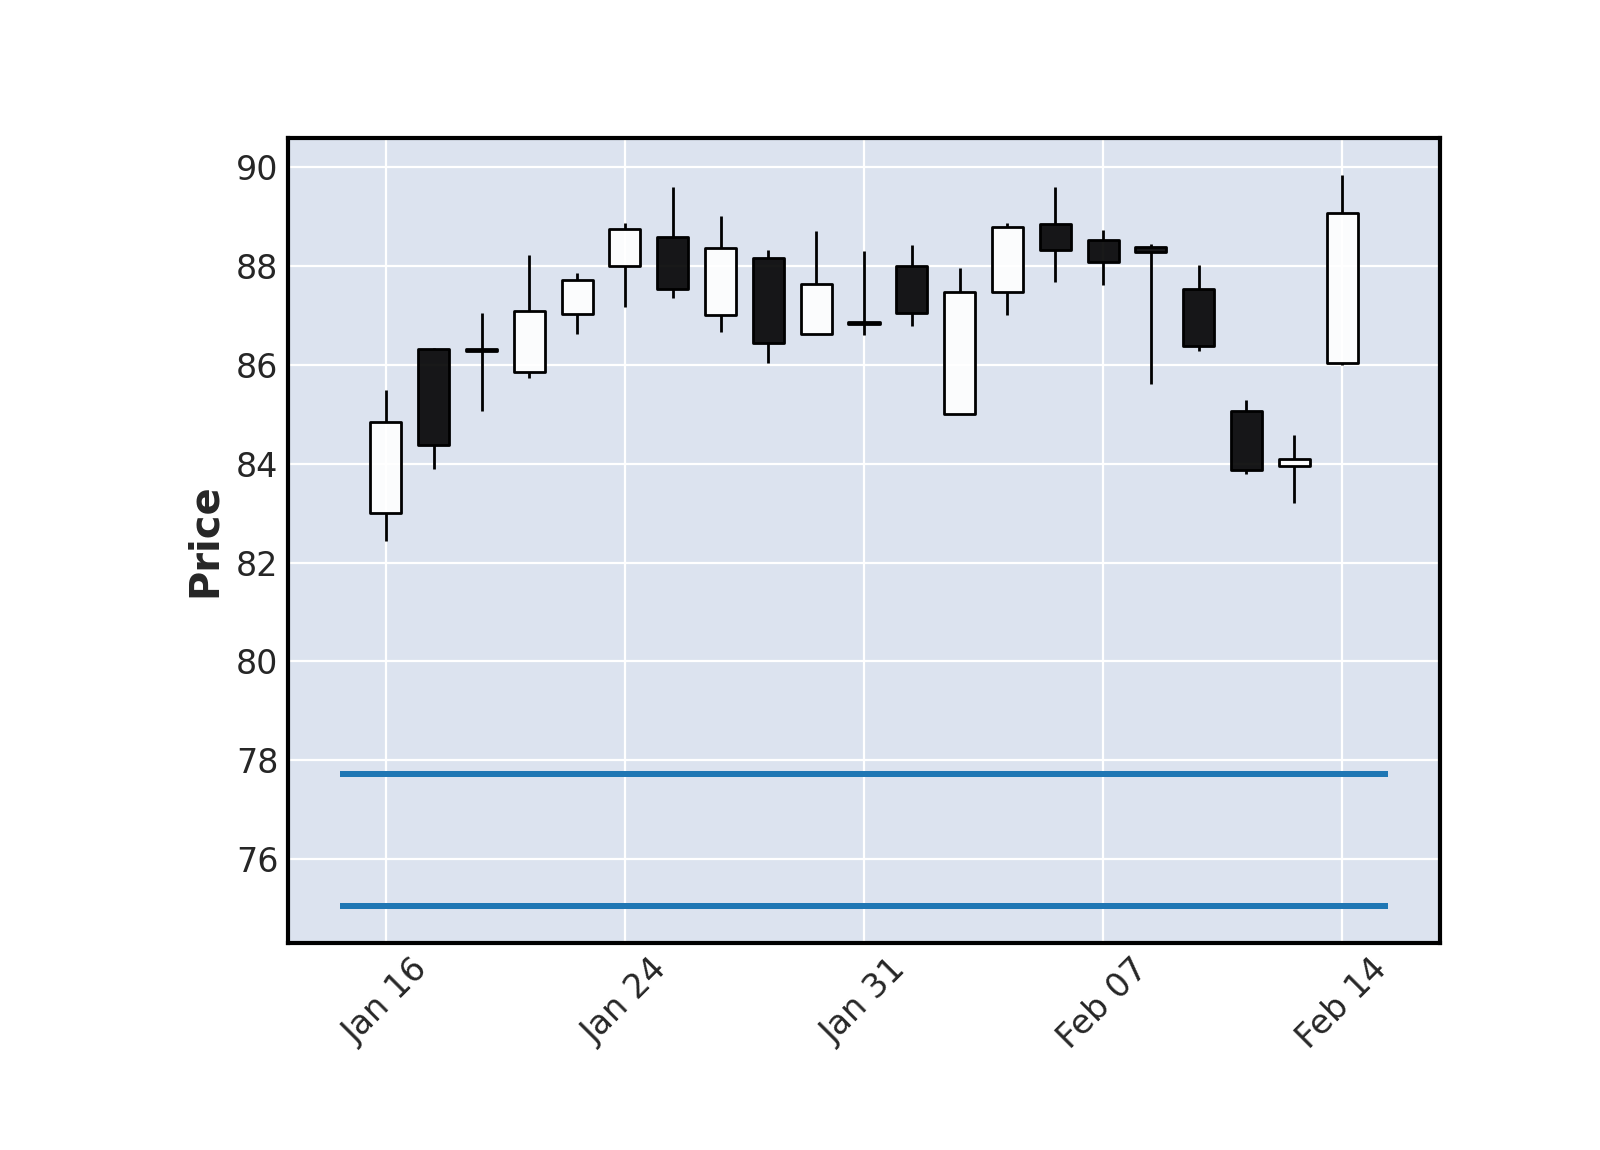
SUPPORTS ET RESISTANCES
| Support Résistance | Rebond | Ecart avec le cours |
|---|---|---|
| 88.76 | 3 | 17.14% |
| 80.89 | 3 | 6.74% |
| 74.93 | 5 | -1.12% |
| 68.54 | 3 | -9.55% |
Historique de cours - DEXCOM
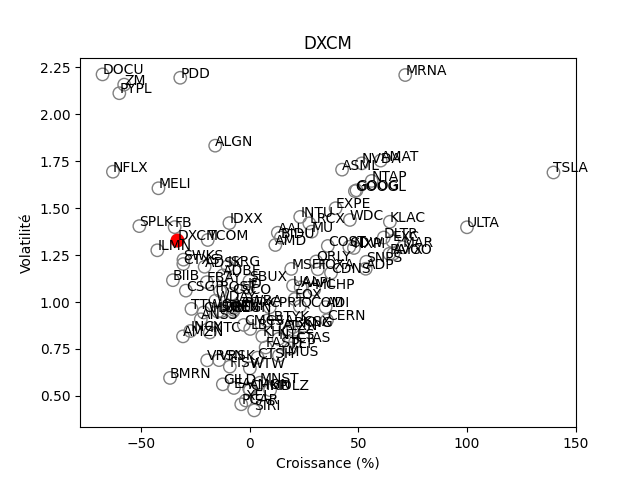
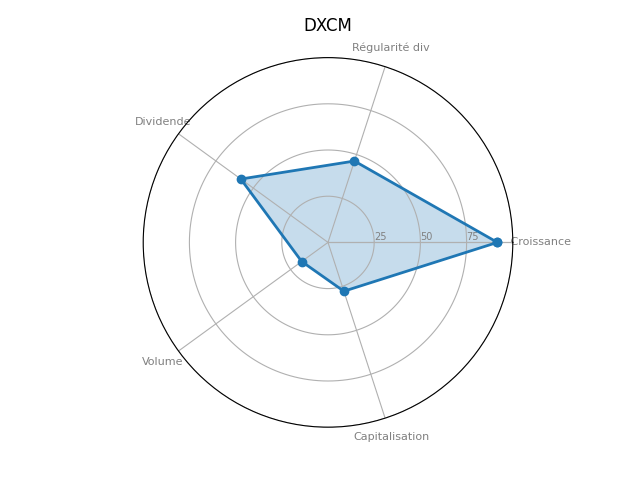
Positionnement boursier de DEXCOM
Version Beta