| Action | MMA | MACD_MME | Bollinger | Stochastique | RSI | Chandelier |
|---|---|---|---|---|---|---|
| DOLLAR TREE | RAS | Signal ↑ : 0.0258% | RAS | Neutre | RAS | Neutre | RAS |
DOLLAR TREE : 98.26
| 1j | 5j | 1m | 3m | 1a |
|---|---|---|---|---|
| 0.49% | 0% | 0% | 0% | -10.77% |
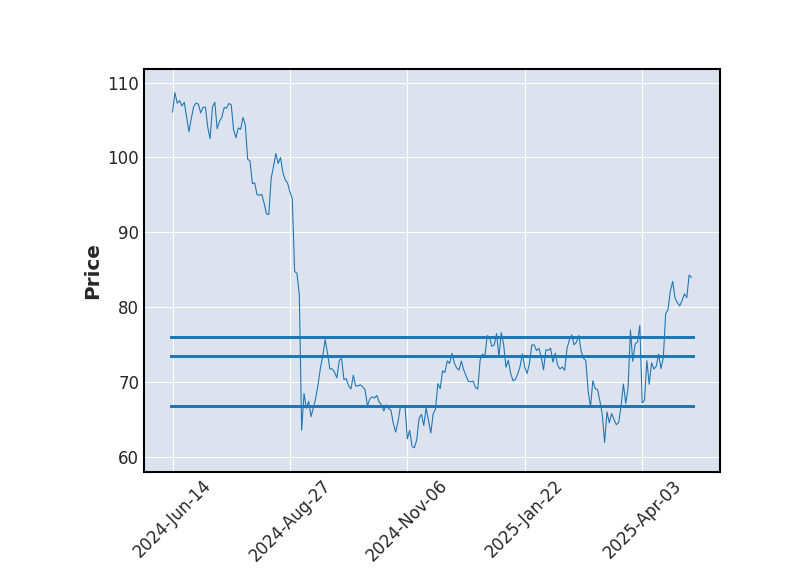
Evolution annuelle
Min : 94.9Moy : 109.62Max : 118.06
|
98.26
| Court terme | Moyen terme | Long terme |
|---|---|---|
 | |  |


Analyse Boursicot du 18/09/2025
Graphique boursier
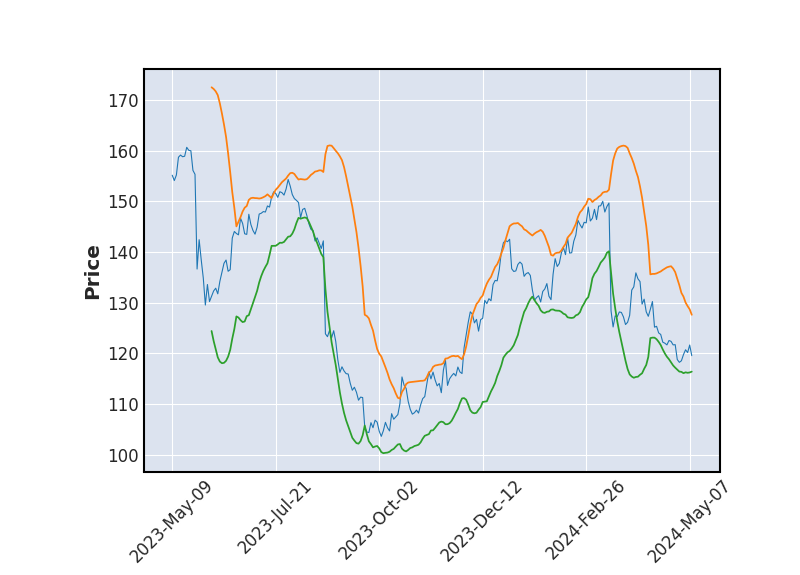 Bollinger
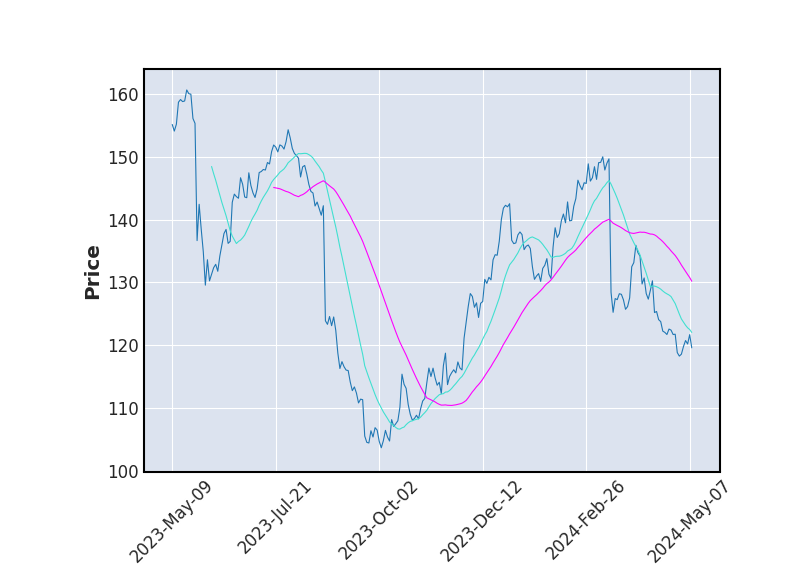 Moyenne Mobile
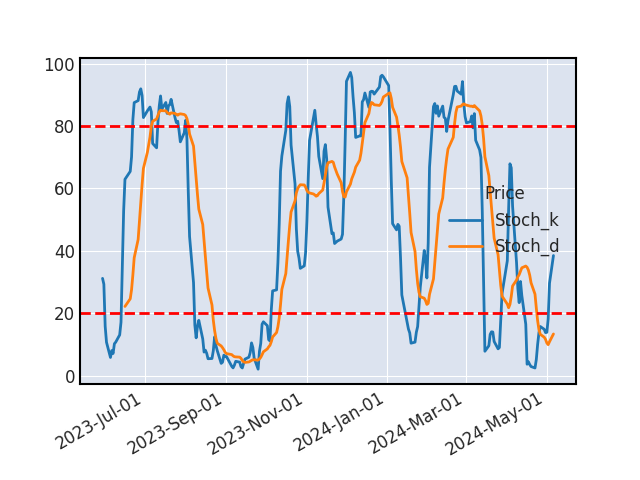 Stochastique
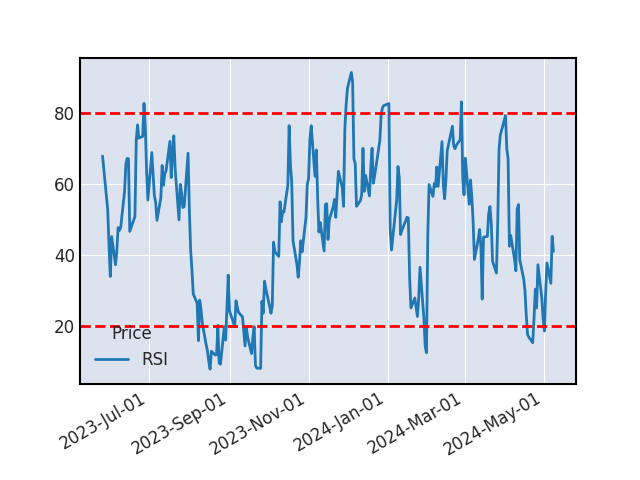 RSI
RSIMACD
L'action DOLLAR TREE semble se diriger vers une hausse (suite au croisement de la MACD et de sa courbe de signal). Ce signal est à confirmer.
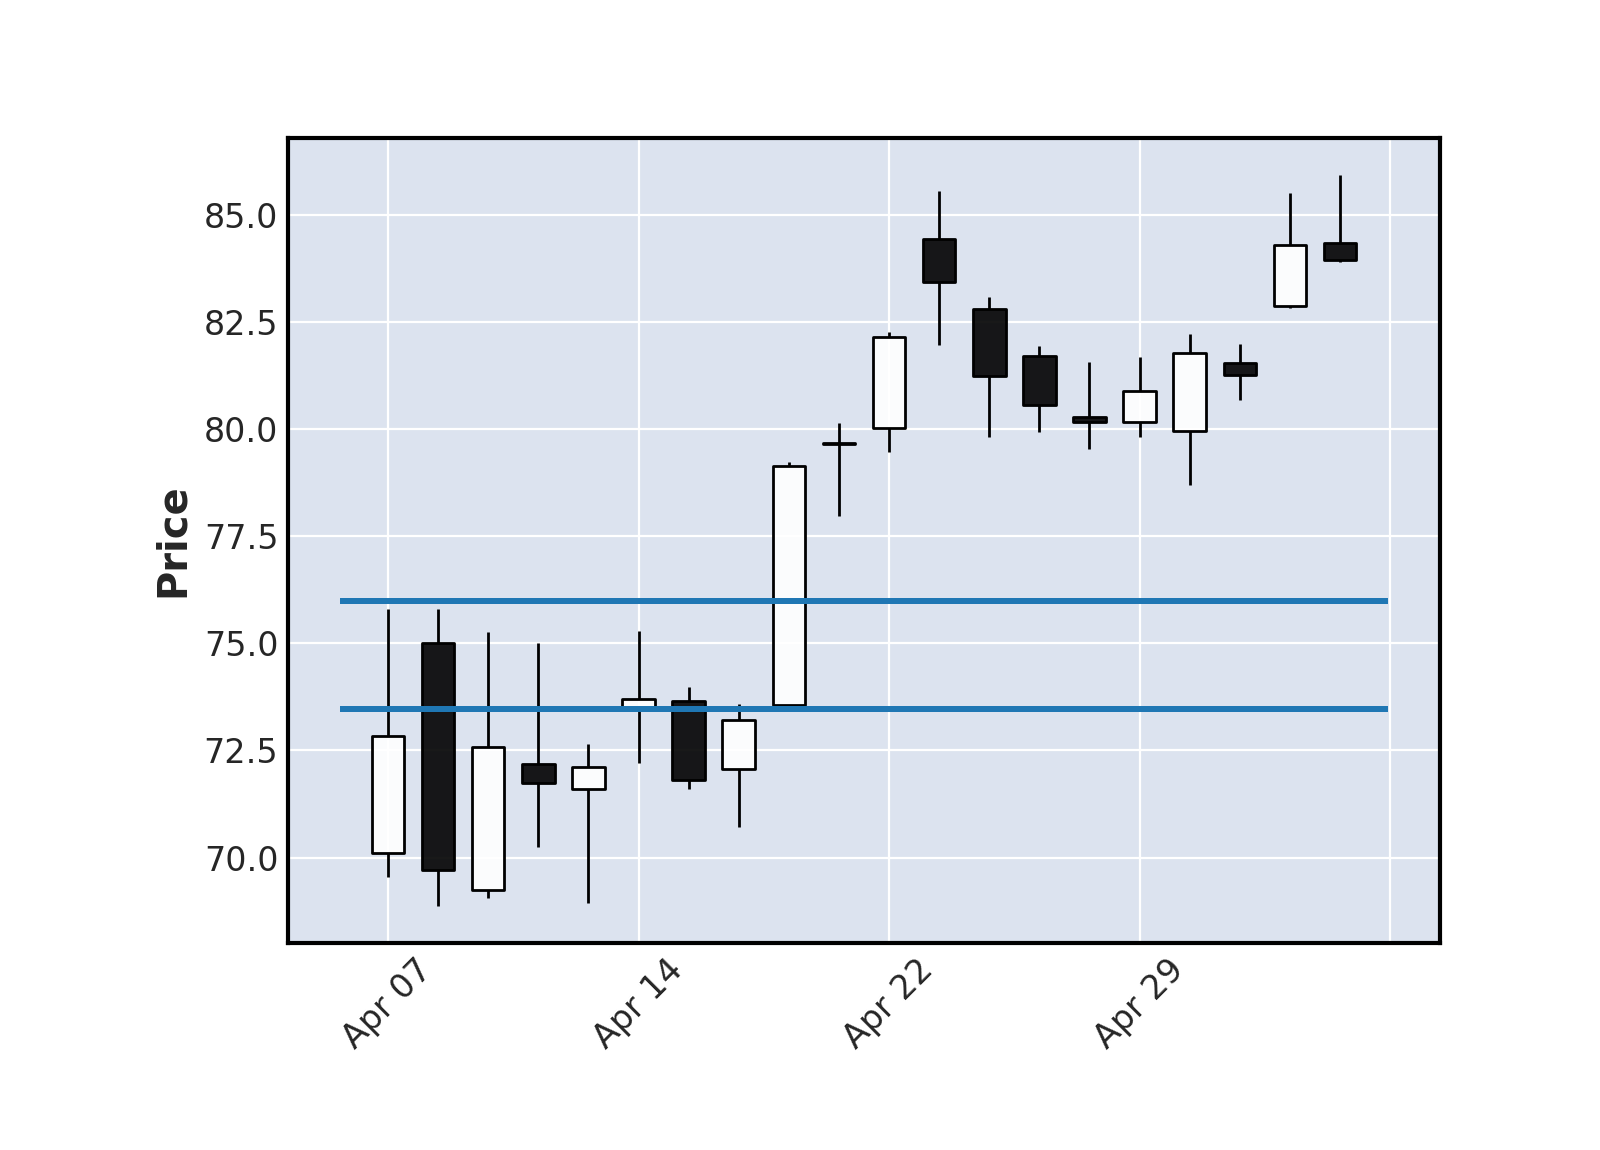
SUPPORTS ET RESISTANCES
| Support Résistance | Rebond | Ecart avec le cours |
|---|---|---|
| 73.47 | 3 | -25.22% |
| 66.81 | 3 | -32.01% |
Historique de cours - DOLLAR TREE
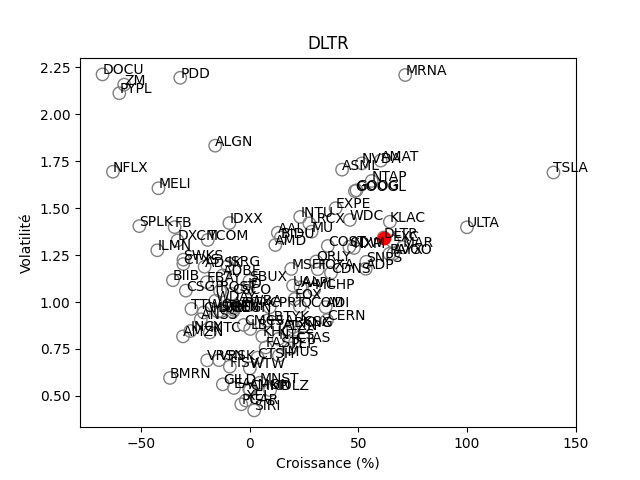
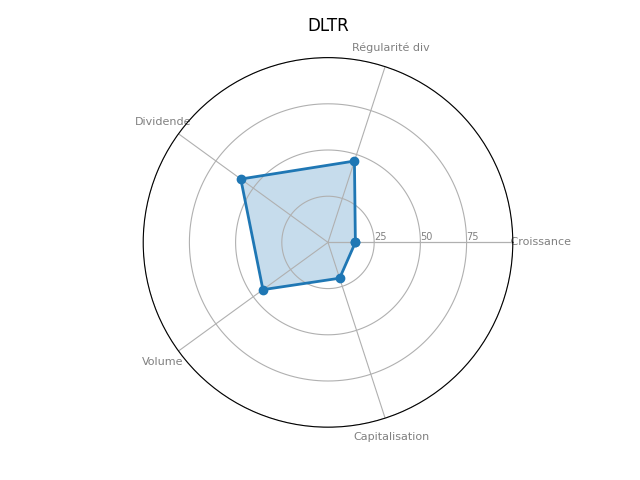
Positionnement boursier de DOLLAR TREE
Version Beta