| Action | MMA | MACD_MME | Bollinger | Stochastique | RSI | Chandelier |
|---|---|---|---|---|---|---|
| FASTENAL | RAS | RAS | RAS | Neutre | RAS | Neutre | RAS |
FASTENAL : 47.22
| 1j | 5j | 1m | 3m | 1a |
|---|---|---|---|---|
| 0.21% | 0% | 0% | 0% | -41.19% |
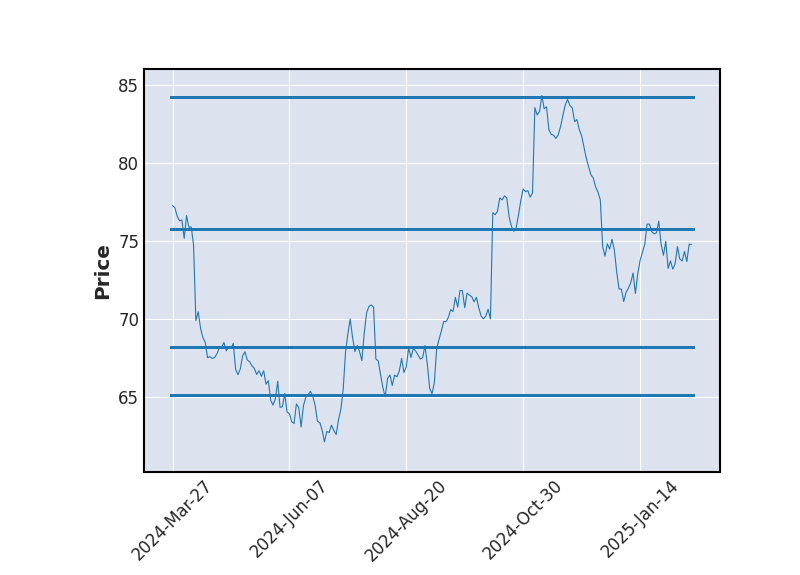
Evolution annuelle
Min : 40.14Moy : 50.33Max : 83.43
|
47.22
| Court terme | Moyen terme | Long terme |
|---|---|---|
 |  | |


Analyse Boursicot du 18/09/2025
Graphique boursier
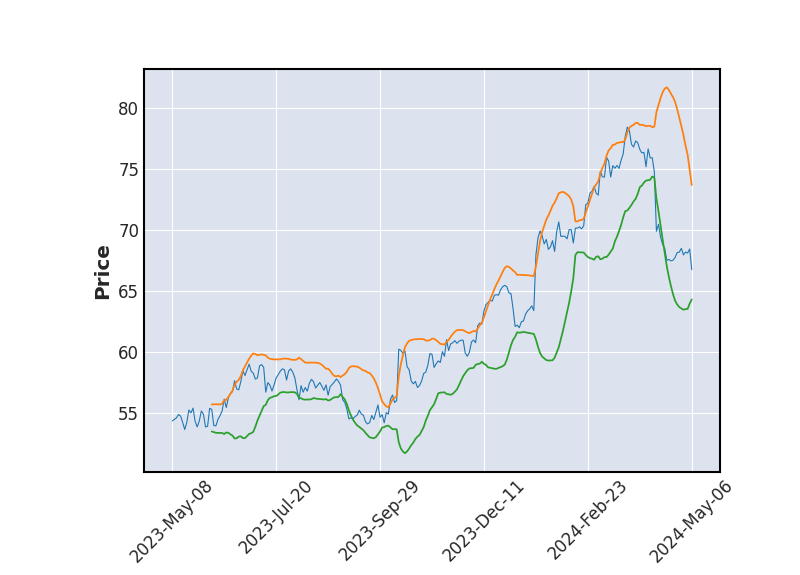 Bollinger
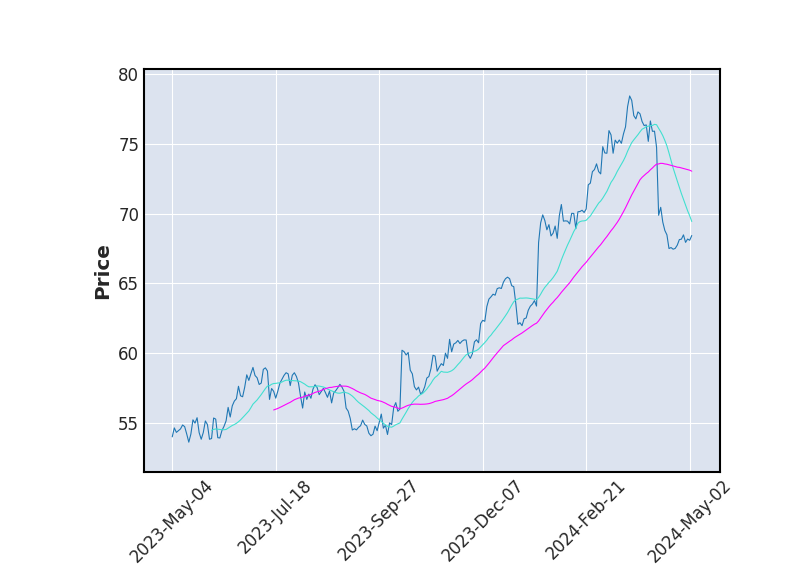 Moyenne Mobile
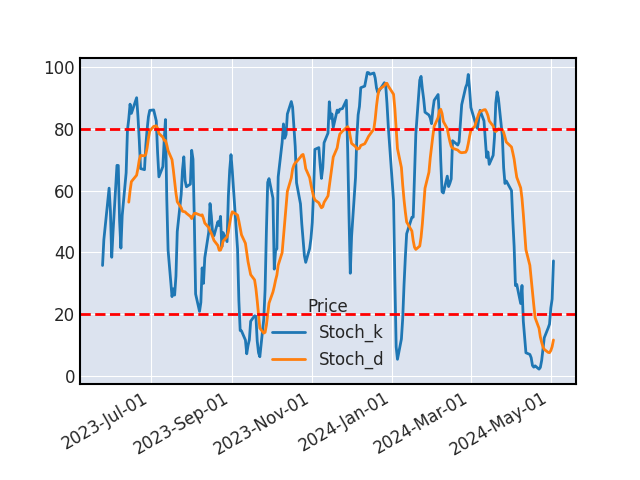 Stochastique
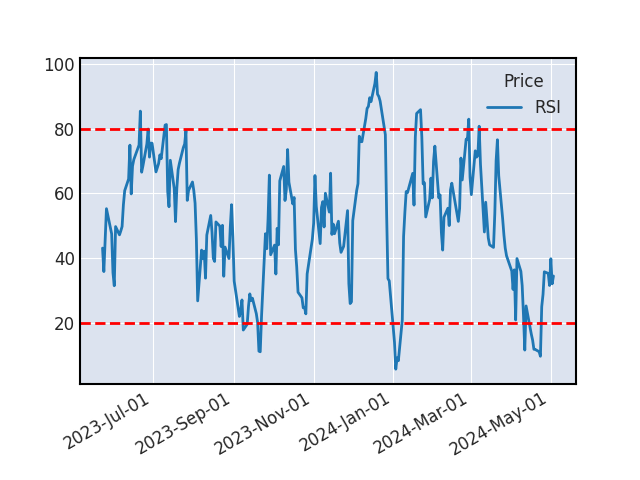 RSI
RSIAucun signal d'achat ou de vente sur le titre aujourd'hui.
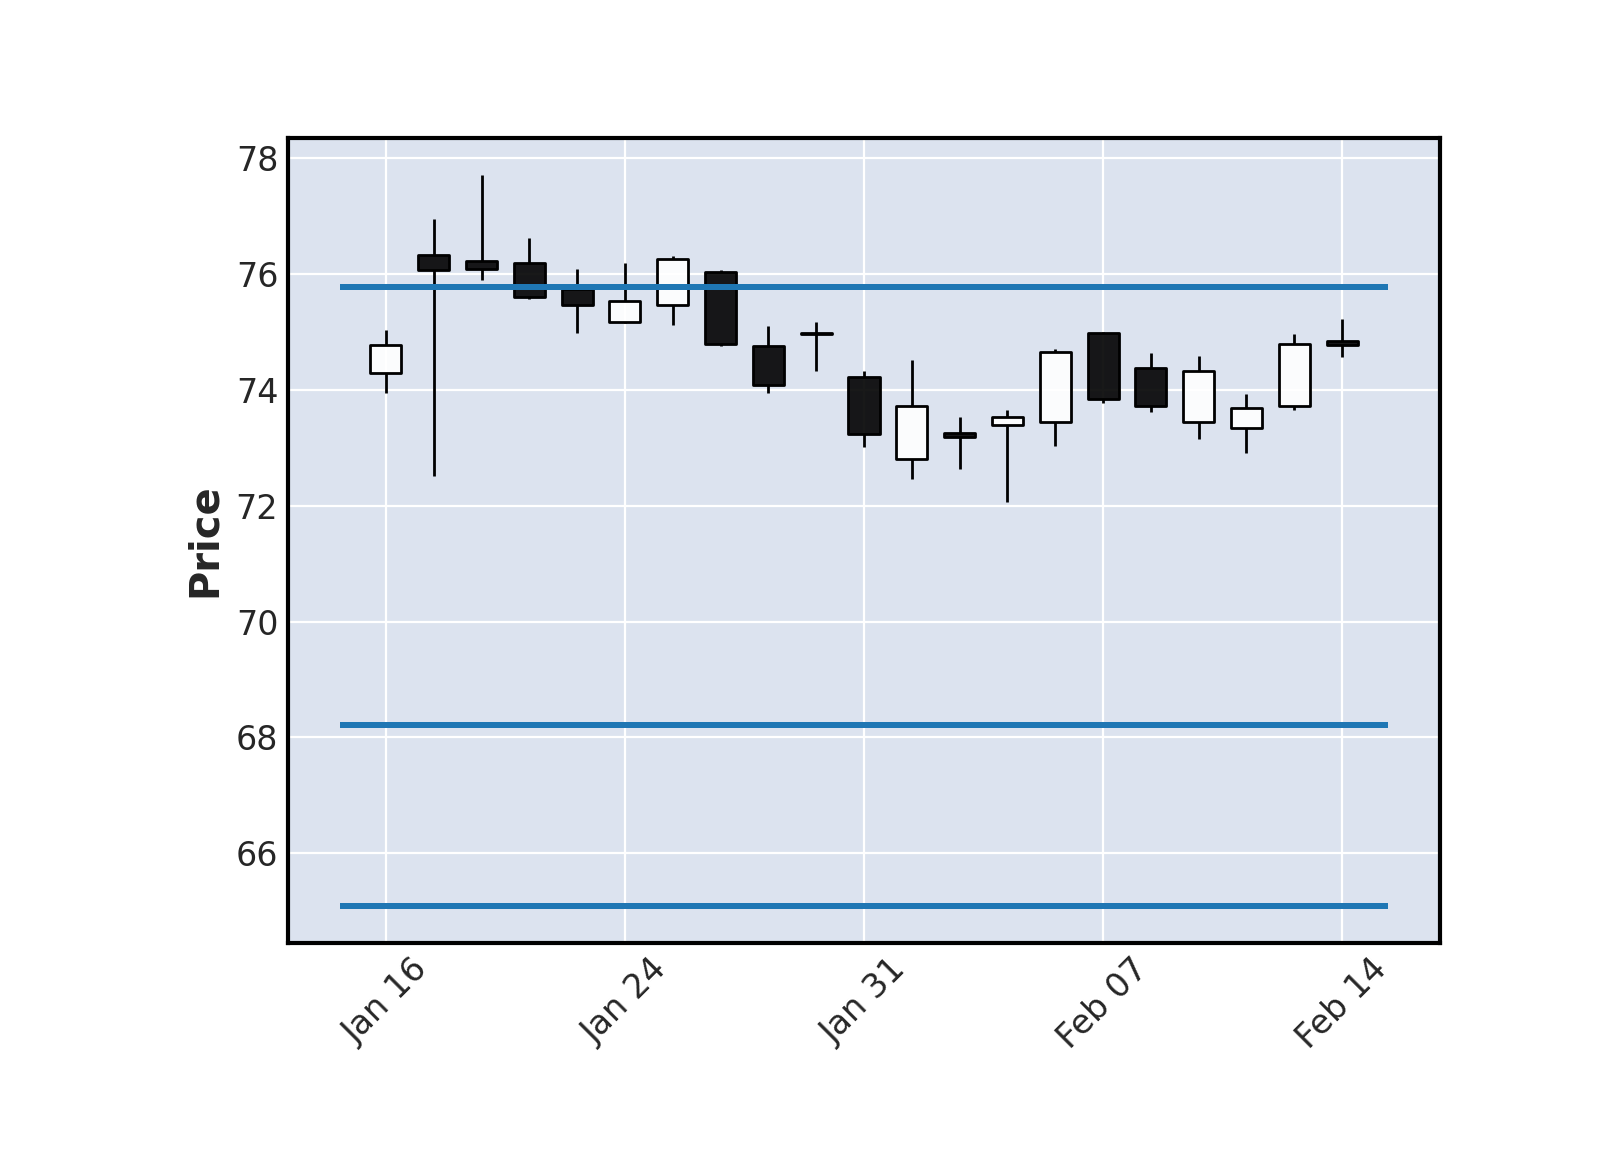
SUPPORTS ET RESISTANCES
| Support Résistance | Rebond | Ecart avec le cours |
|---|---|---|
| 50.33 | 2 | 6.59% |
| 41.84 | 3 | -11.38% |
| 40.86 | 7 | -13.48% |
| 37.8 | 3 | -19.95% |
| 36.72 | 3 | -22.24% |
Historique de cours - FASTENAL
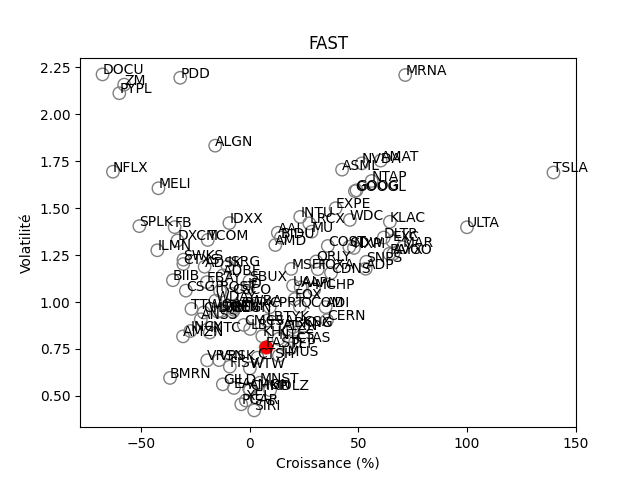
Positionnement boursier de FASTENAL

Version Beta