| Action | MMA | MACD_MME | Bollinger | Stochastique | RSI | Chandelier |
|---|---|---|---|---|---|---|
| NETFLIX | RAS | RAS | RAS | Neutre | RAS | Neutre | RAS |
NETFLIX : 1207.78
| 1j | 5j | 1m | 3m | 1a |
|---|---|---|---|---|
| -1.69% | 0% | 0% | 0% | 22.26% |
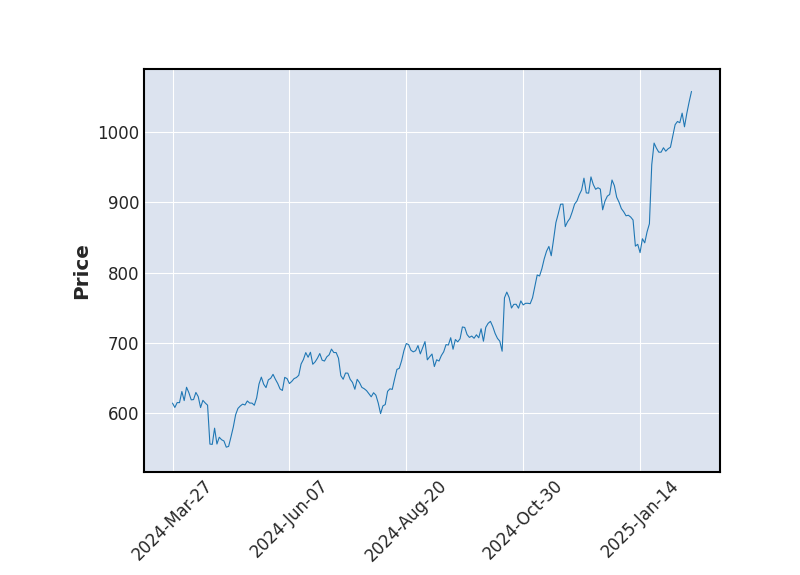
Evolution annuelle
Min : 973.05Moy : 1210.79Max : 1341.15
|
1207.78
| Court terme | Moyen terme | Long terme |
|---|---|---|
 |  | |


Analyse Boursicot du 18/09/2025
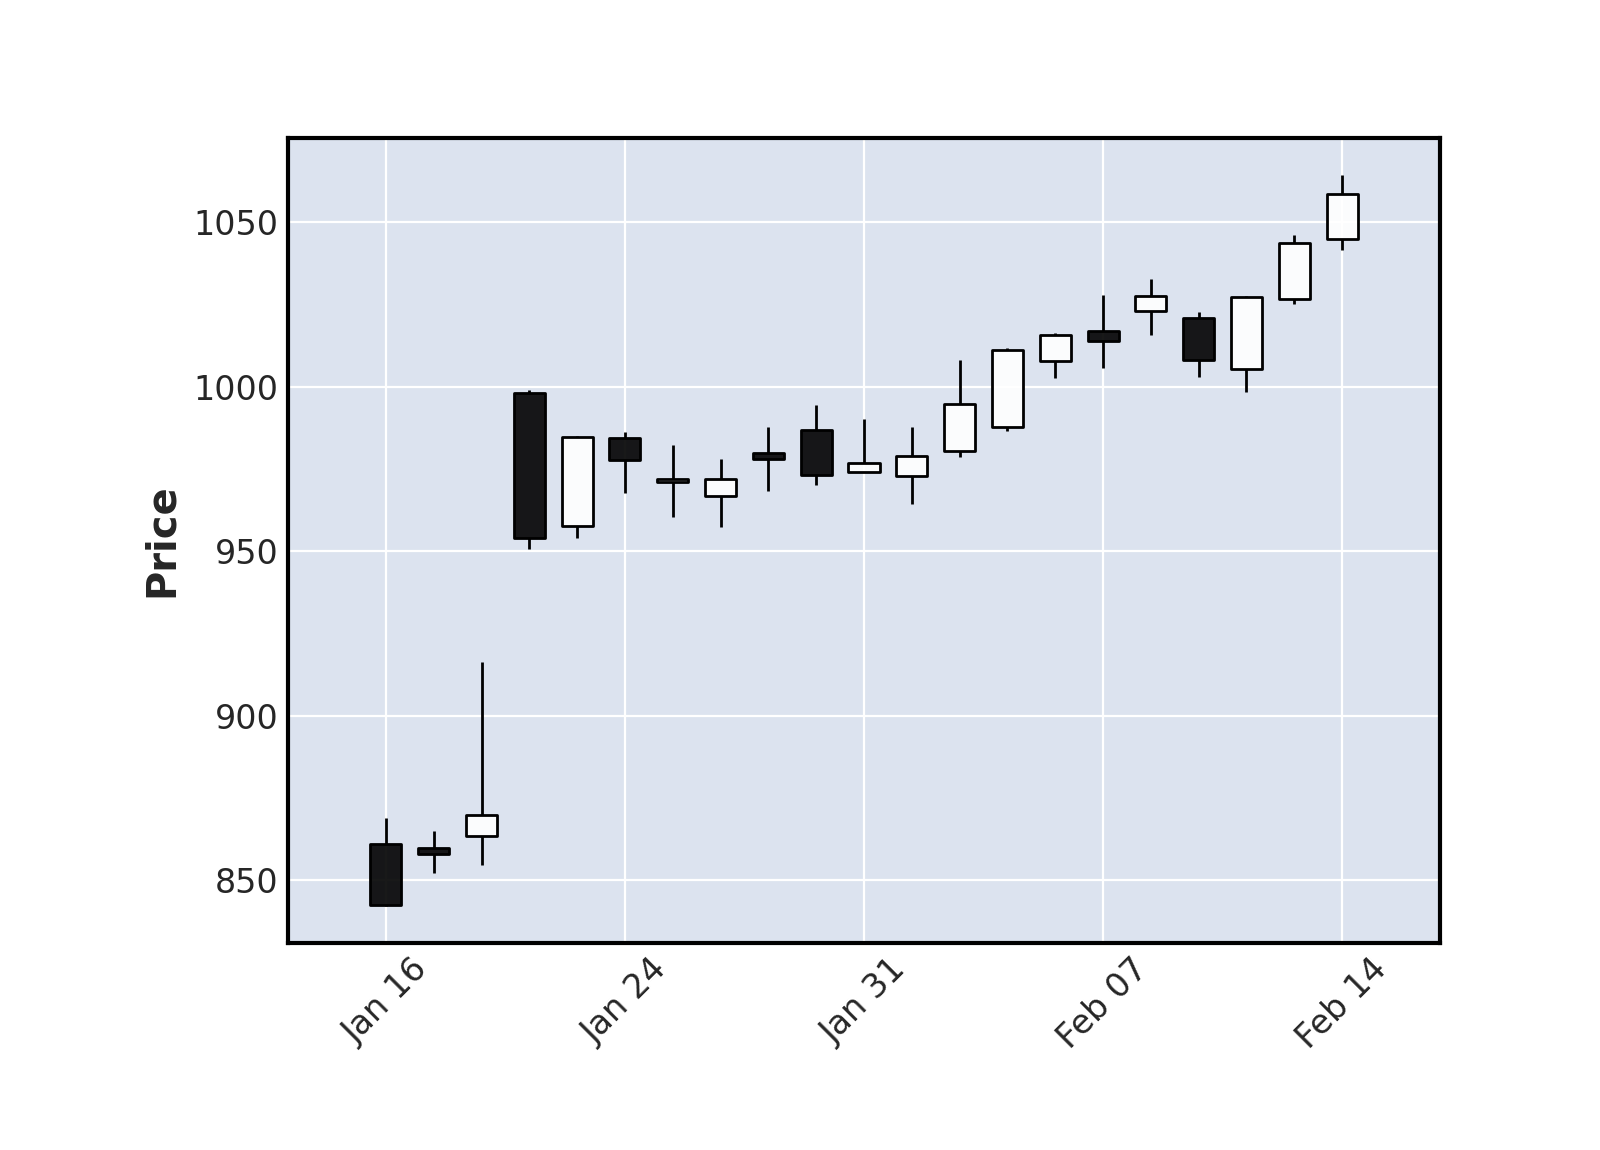
Graphique boursier
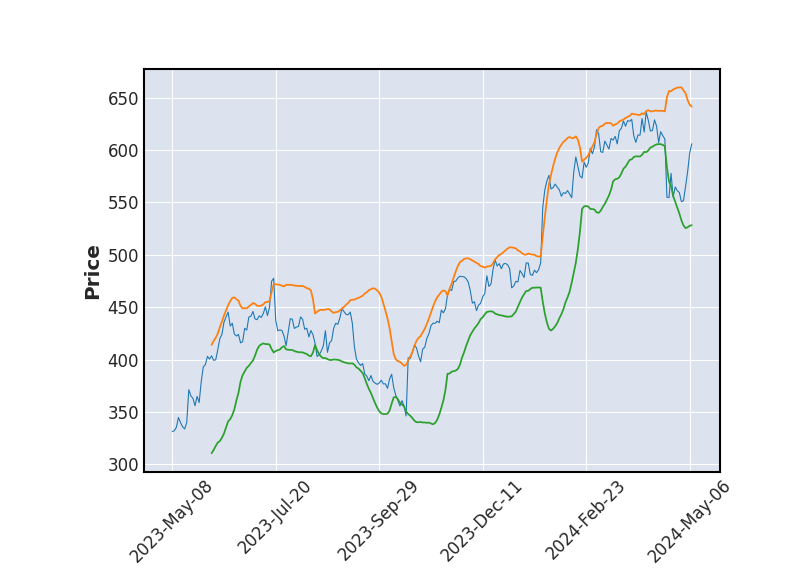 Bollinger
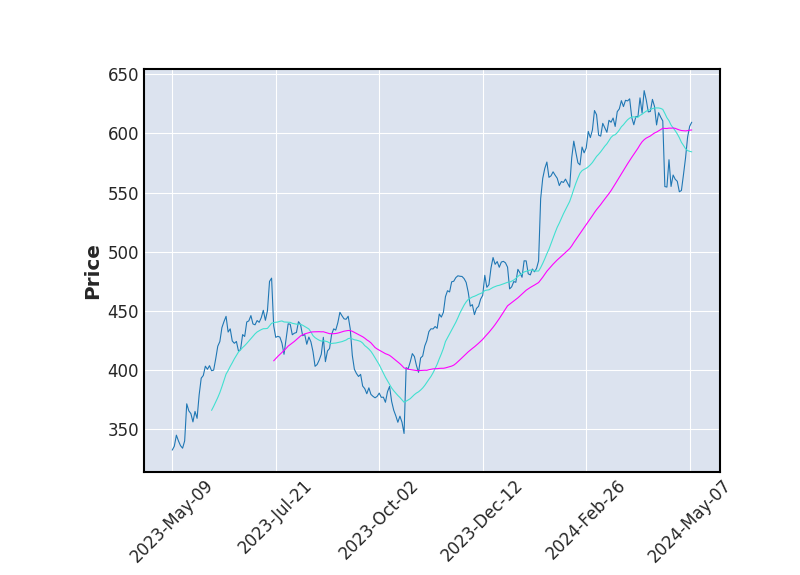 Moyenne Mobile
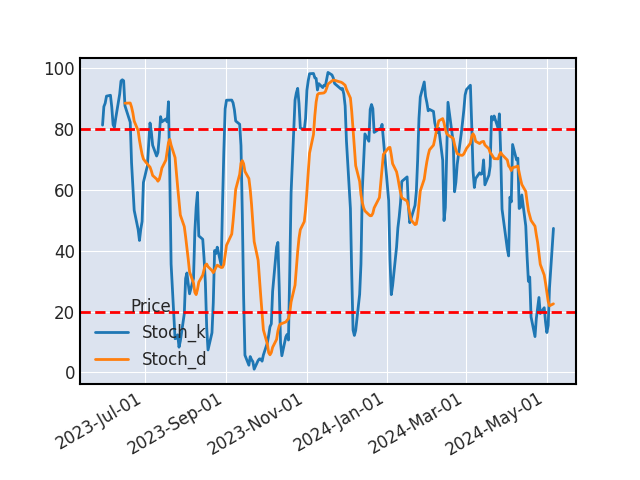 Stochastique
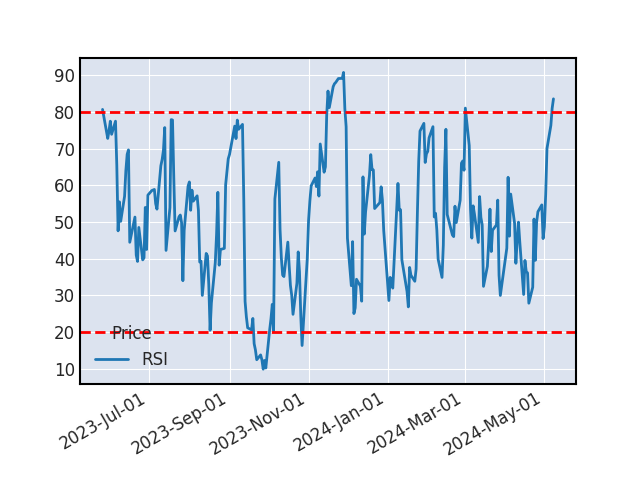 RSI
RSILe titre ne donne aucun signal d'achat ou de vente.
SUPPORTS ET RESISTANCES
| Support Résistance | Rebond | Ecart avec le cours |
|---|---|---|
| 987.89 | 3 | -18.21% |
Historique de cours - NETFLIX
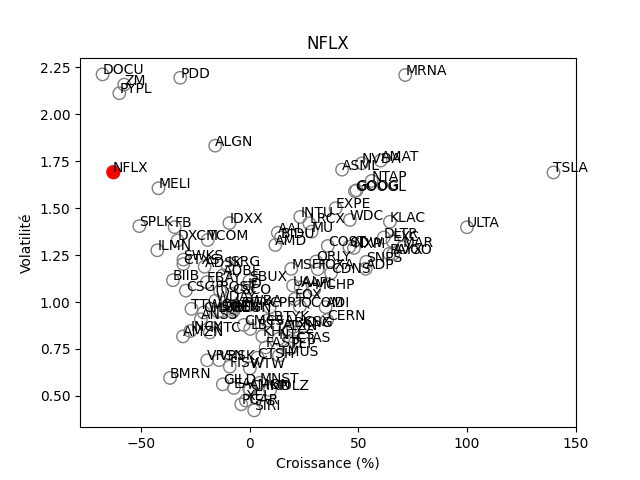
Positionnement boursier de NETFLIX

Version Beta