| Action | MMA | MACD_MME | Bollinger | Stochastique | RSI | Chandelier |
|---|---|---|---|---|---|---|
| NXP SEMICONDUCTOR | RAS | RAS | RAS | Sur-vente↑ | RAS | Neutre | RAS |
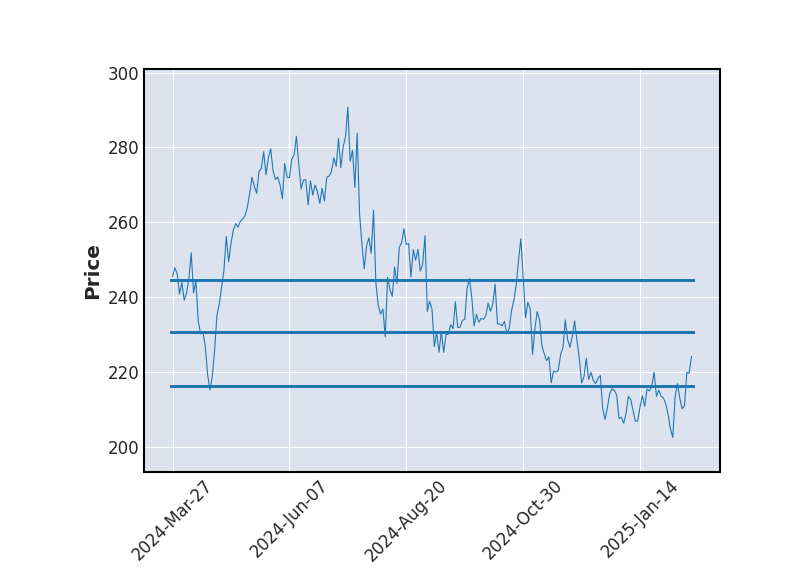
NXP SEMICONDUCTOR : 226.51
| 1j | 5j | 1m | 3m | 1a |
|---|---|---|---|---|
| 2.08% | 0% | 0% | 0% | 0.27% |
Evolution annuelle
Min : 203.24Moy : 224.26Max : 241.42
|
226.51
| Court terme | Moyen terme | Long terme |
|---|---|---|
 |  | |


Analyse Boursicot du 18/09/2025
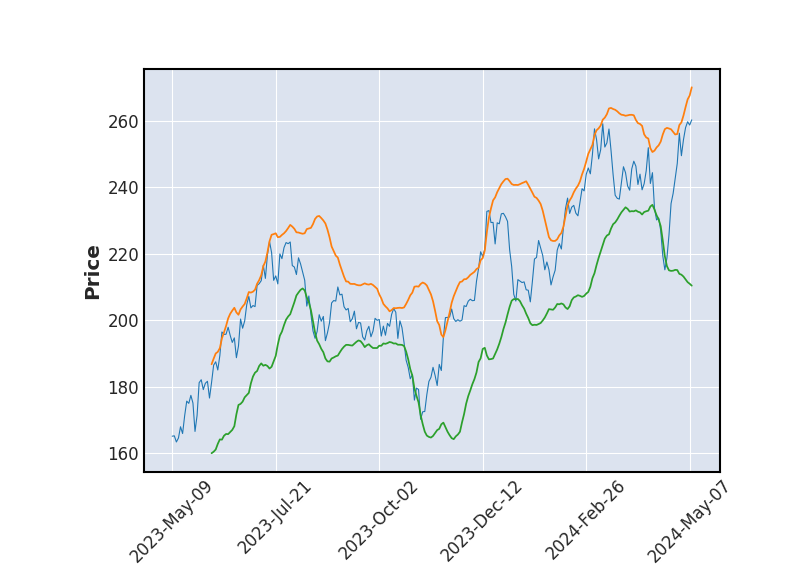
Graphique boursier
 Bollinger
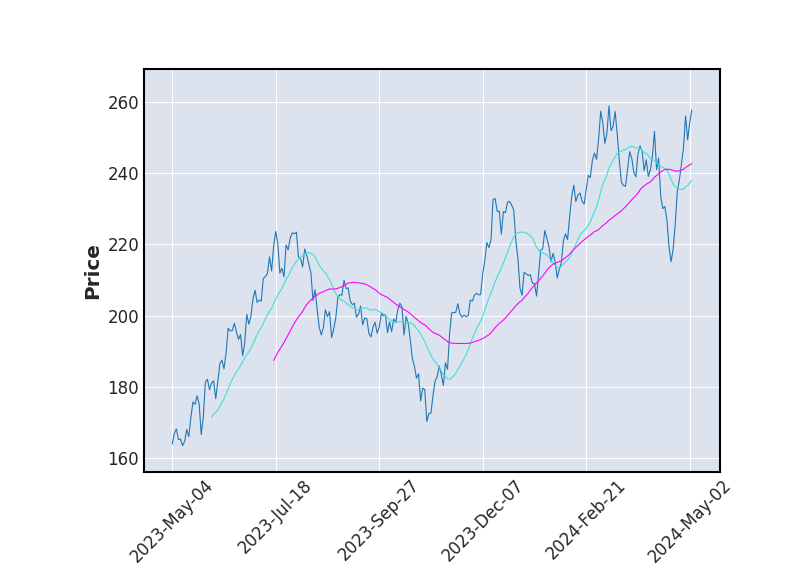 Moyenne Mobile
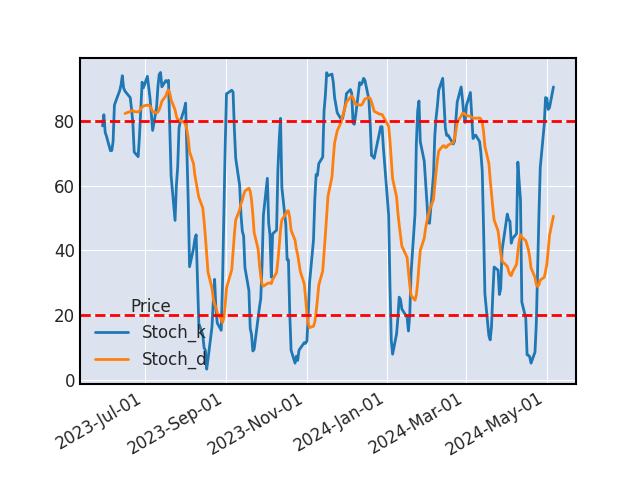 Stochastique
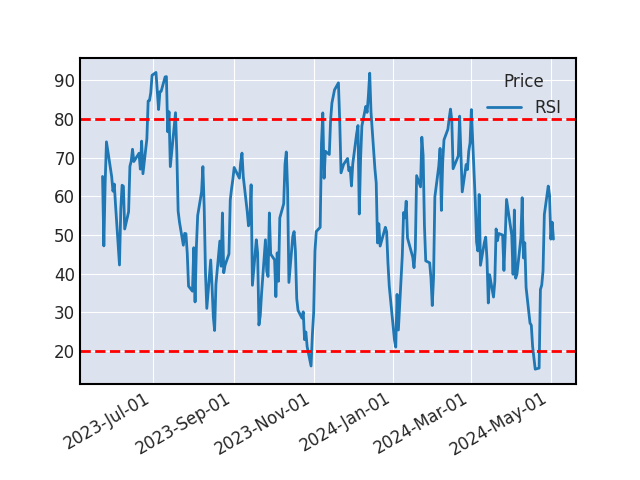 RSI
RSISTOCHASTIQUE
Le stochastique vient de sortir de la zone de sur-vente indiquant une hausse à venir sur le titre NXP SEMICONDUCTOR. Une hausse devrait survenir sur le titre suite au croisement du stochastique %K et de son signal %D en cas de confirmation par un autre indicateur technique.
SUPPORTS ET RESISTANCES
| Support Résistance | Rebond | Ecart avec le cours |
|---|---|---|
| 244.18 | 3 | 7.8% |
| 231.01 | 5 | 1.99% |
| 219.96 | 8 | -2.89% |
| 206.21 | 4 | -8.96% |
Historique de cours - NXP SEMICONDUCTOR

Positionnement boursier de NXP SEMICONDUCTOR

Version Beta