| Action | MMA | MACD_MME | Bollinger | Stochastique | RSI | Chandelier |
|---|---|---|---|---|---|---|
| PAYCHEX | RAS | RAS | RAS | Neutre | RAS | Neutre | RAS |
PAYCHEX : 131.11
| 1j | 5j | 1m | 3m | 1a |
|---|---|---|---|---|
| -1.02% | 0% | 0% | 0% | -16.49% |
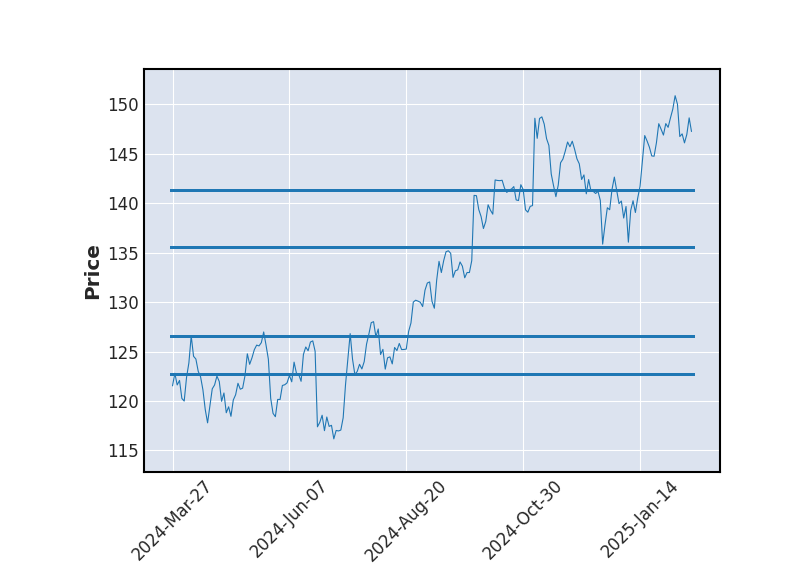
Evolution annuelle
Min : 130.24Moy : 143.95Max : 161.24
|
131.11
| Court terme | Moyen terme | Long terme |
|---|---|---|
 | | |


Analyse Boursicot du 18/09/2025
Graphique boursier
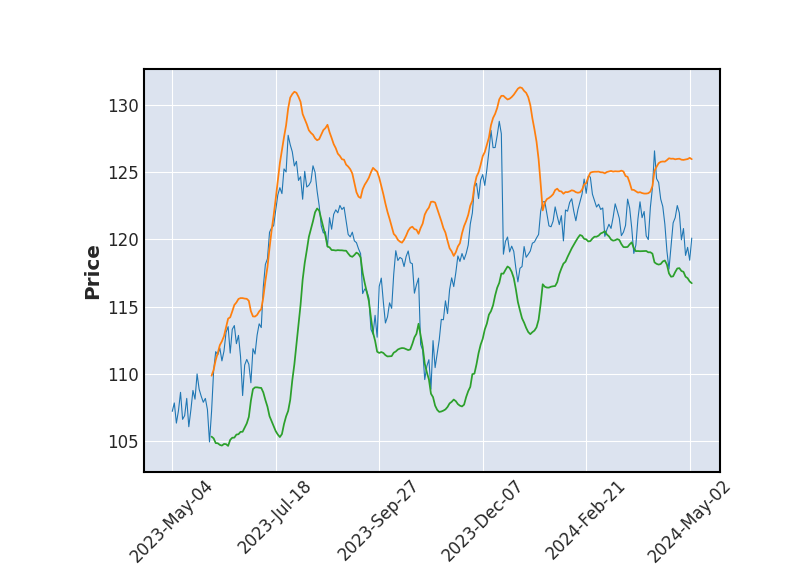 Bollinger
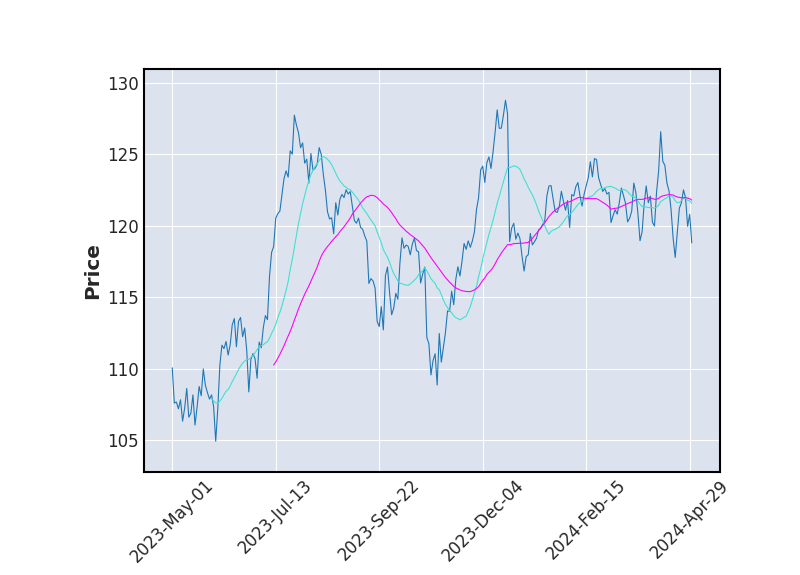 Moyenne Mobile
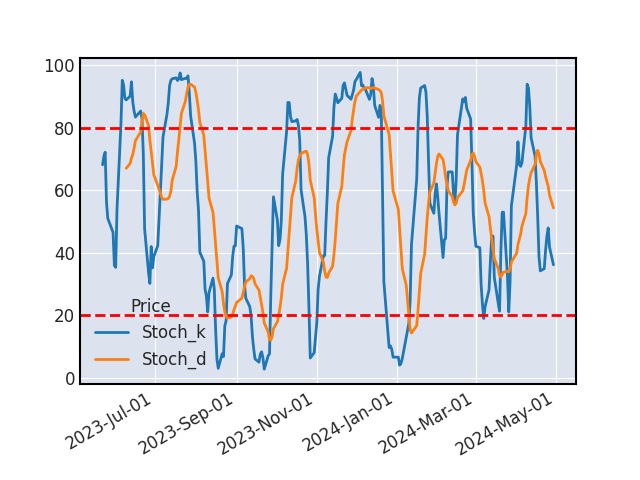 Stochastique
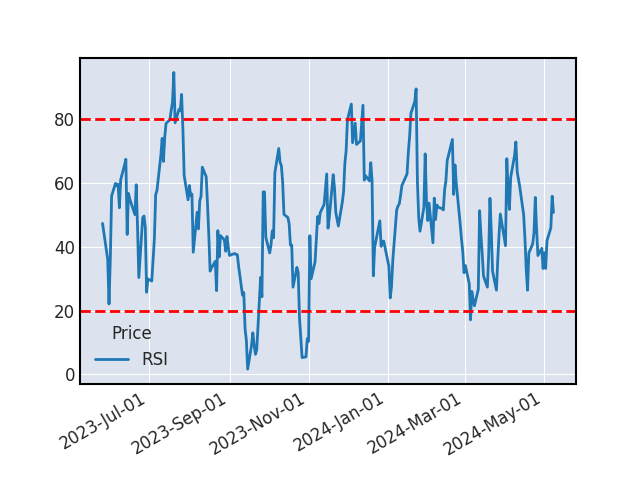 RSI
RSIL'analyse du cours ne permet pas de déterminer de tendance claire.
VOLUME
Les volumes échangés sur le titre PAYCHEX sont particulièrement fort aujourdhui (plus de 50% au-dessus de la moyenne).
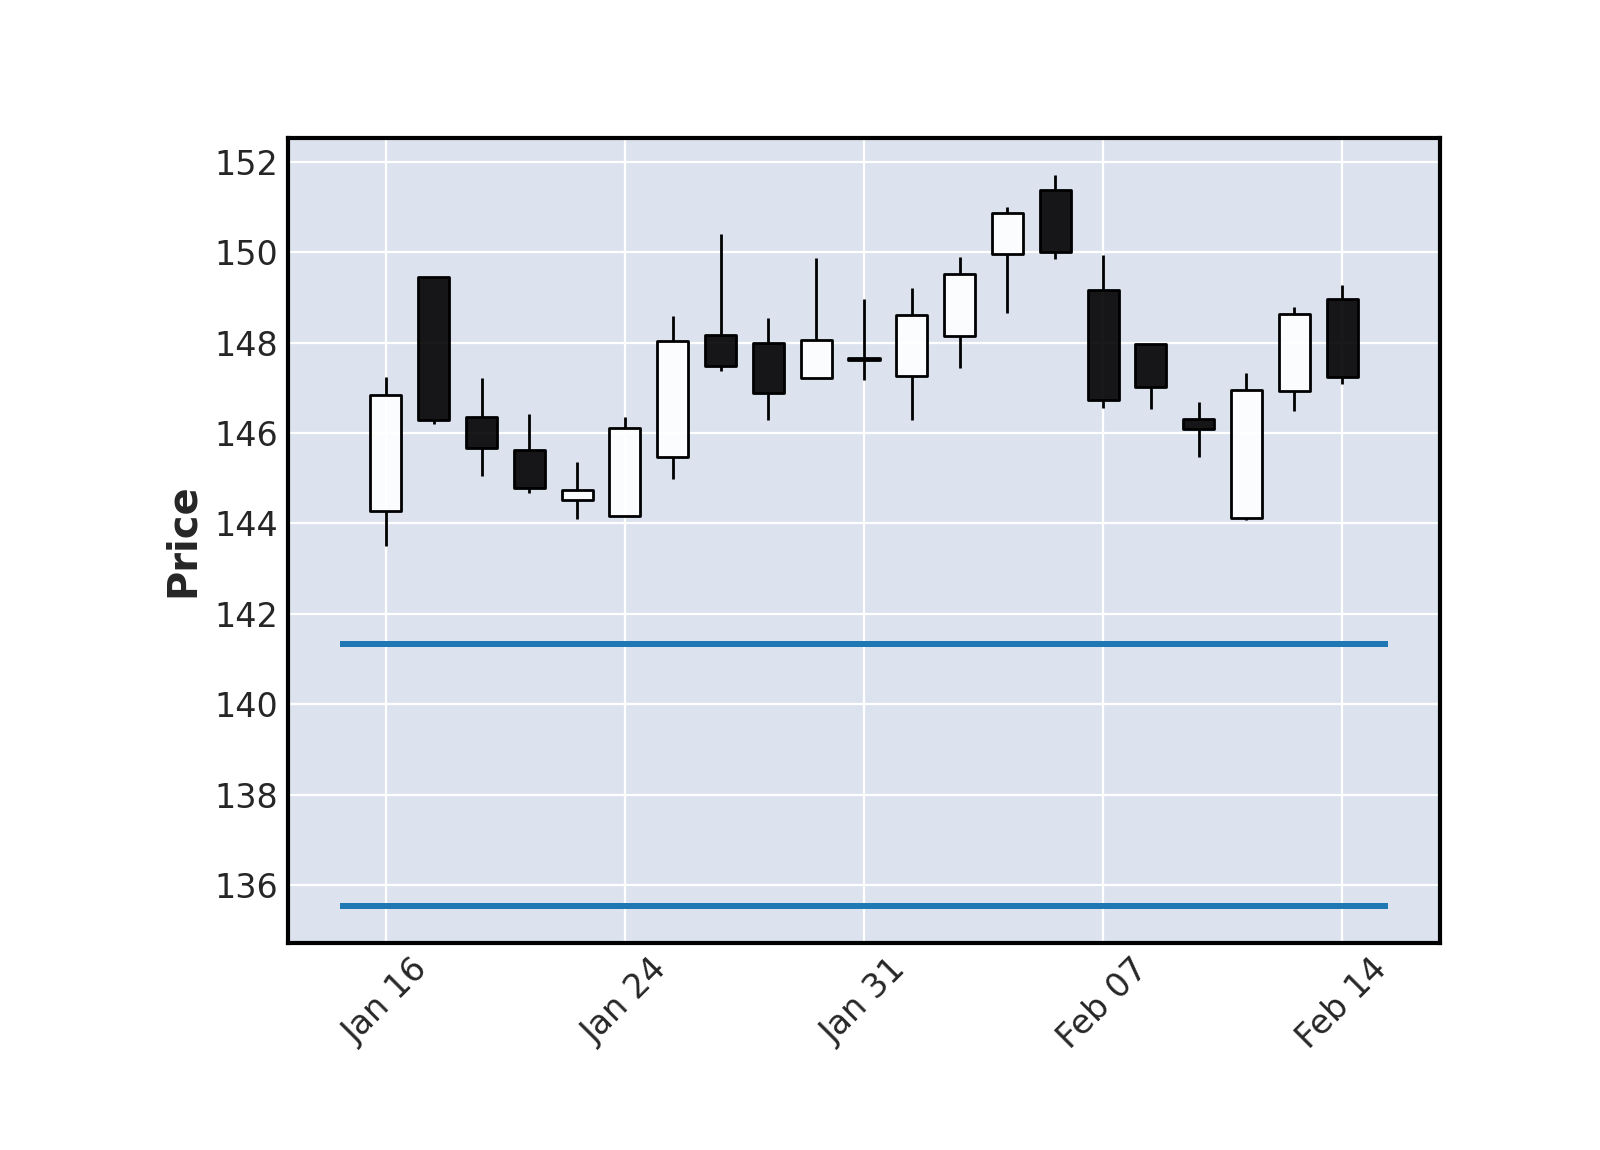
SUPPORTS ET RESISTANCES
| Support Résistance | Rebond | Ecart avec le cours |
|---|---|---|
| 159.38 | 2 | 21.56% |
| 147.19 | 6 | 12.26% |
| 139.78 | 18 | 6.61% |
Historique de cours - PAYCHEX
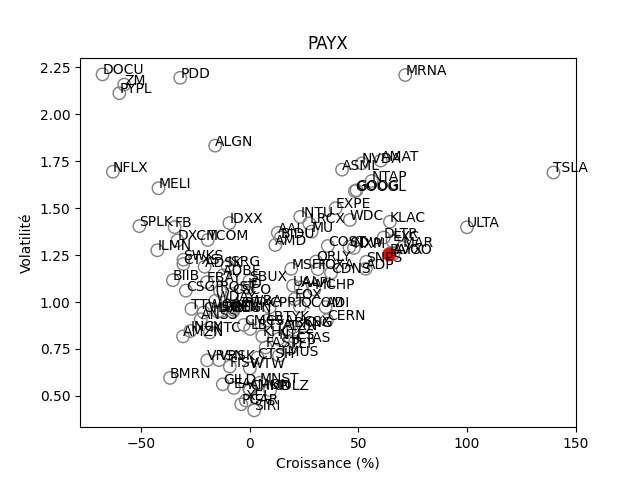
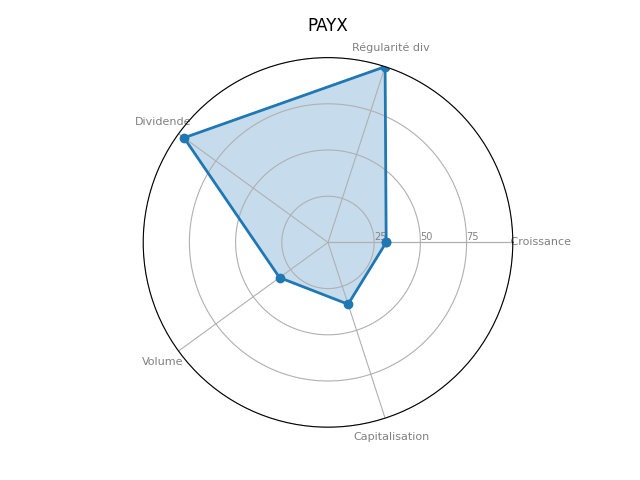
Positionnement boursier de PAYCHEX
Version Beta