| Action | MMA | MACD_MME | Bollinger | Stochastique | RSI | Chandelier |
|---|---|---|---|---|---|---|
| STARBUCKS | RAS | RAS | RAS | Neutre | Signal ↑↑↑ : 10.69% | Neutre | RAS |
STARBUCKS : 83.42
| 1j | 5j | 1m | 3m | 1a |
|---|---|---|---|---|
| 0.24% | 0% | 0% | 0% | -11.07% |
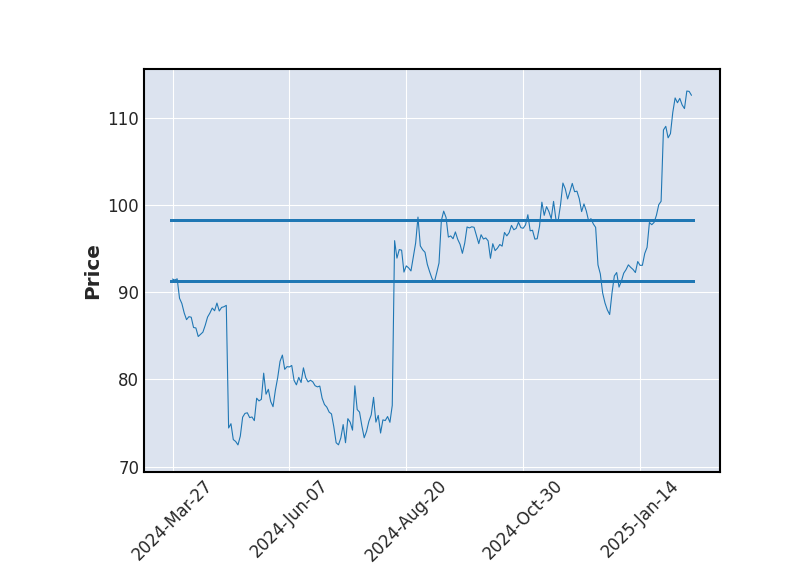
Evolution annuelle
Min : 81.2Moy : 89.12Max : 98.89
|
83.42
| Court terme | Moyen terme | Long terme |
|---|---|---|
 | | |


Analyse Boursicot du 18/09/2025
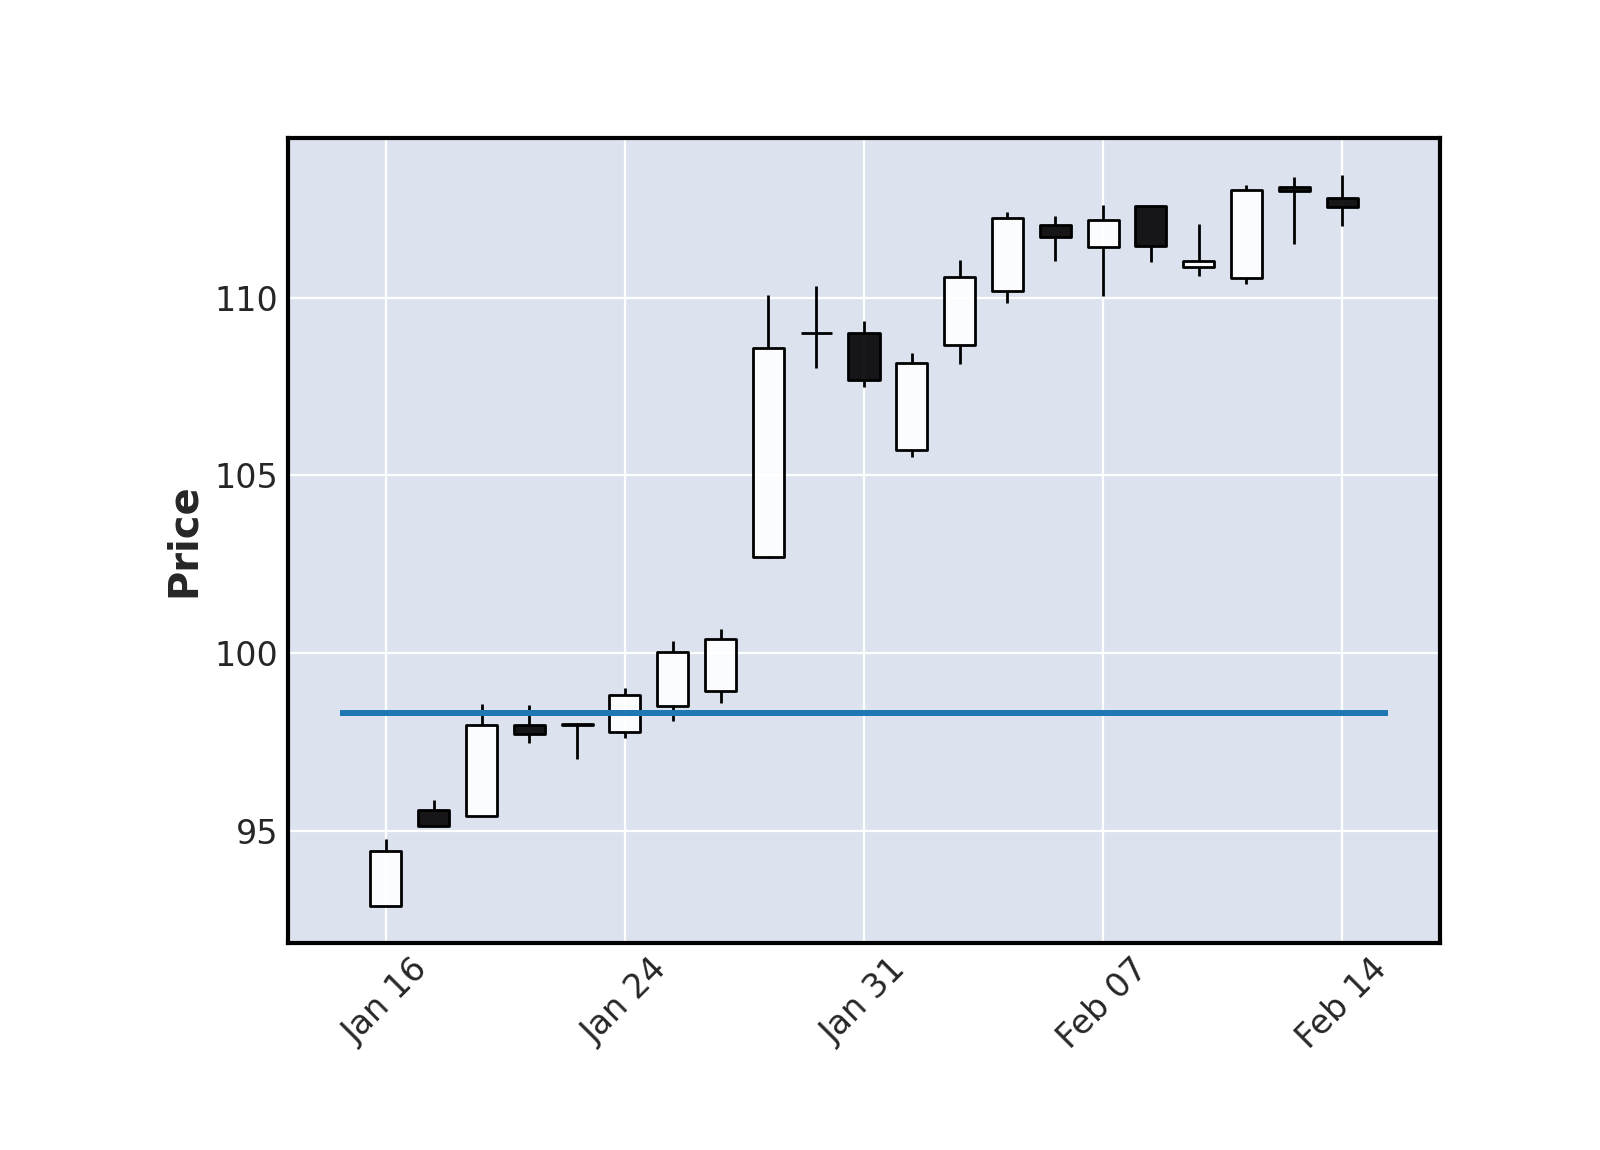
Graphique boursier
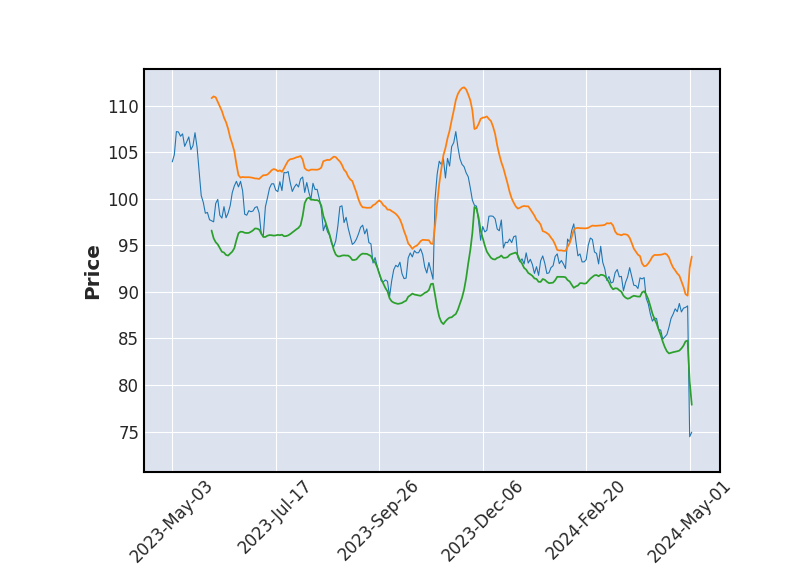 Bollinger
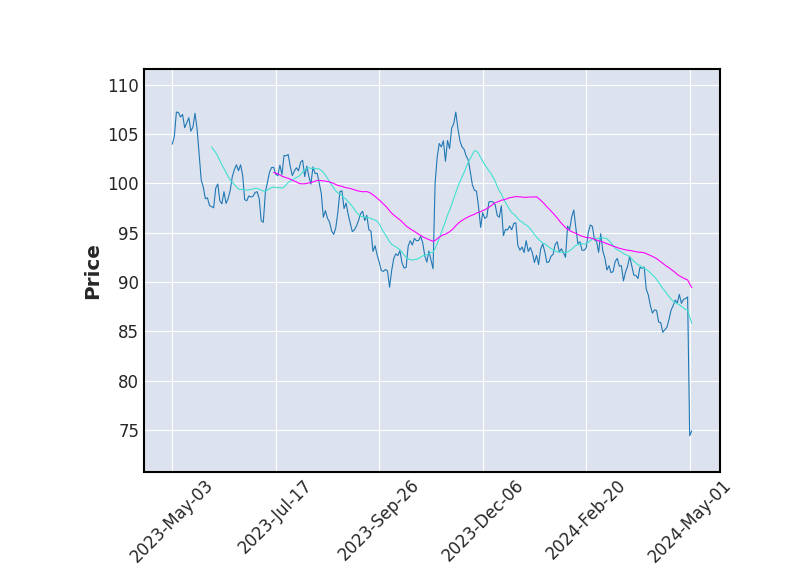 Moyenne Mobile
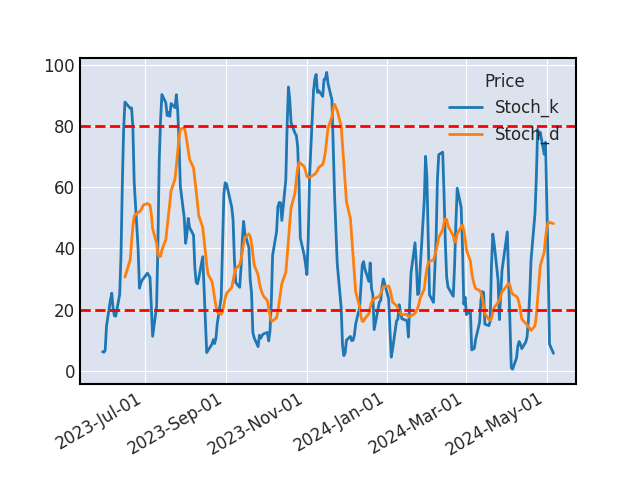 Stochastique
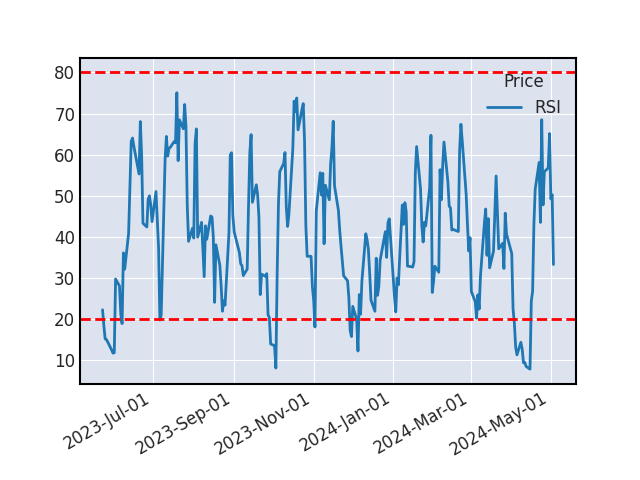 RSI
RSISTOCHASTIQUE
Une hausse devrait survenir sur le titre suite au croisement du stochastique %K et de son signal %D en cas de confirmation par un autre indicateur technique.
SUPPORTS ET RESISTANCES
| Support Résistance | Rebond | Ecart avec le cours |
|---|---|---|
| 96.93 | 11 | 16.2% |
| 87.04 | 4 | 4.34% |
| 80.01 | 4 | -4.08% |
Historique de cours - STARBUCKS
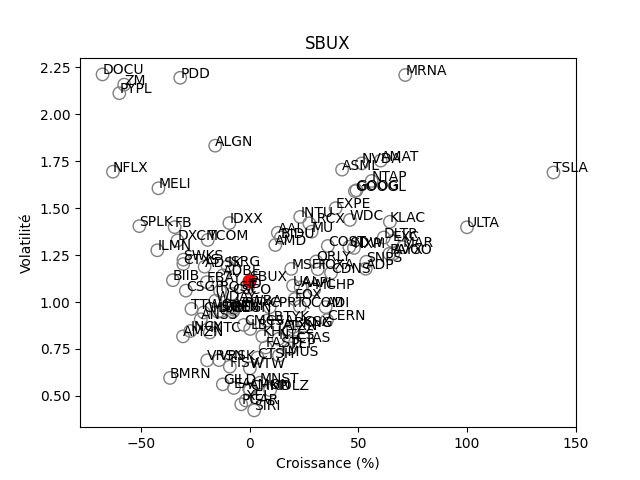
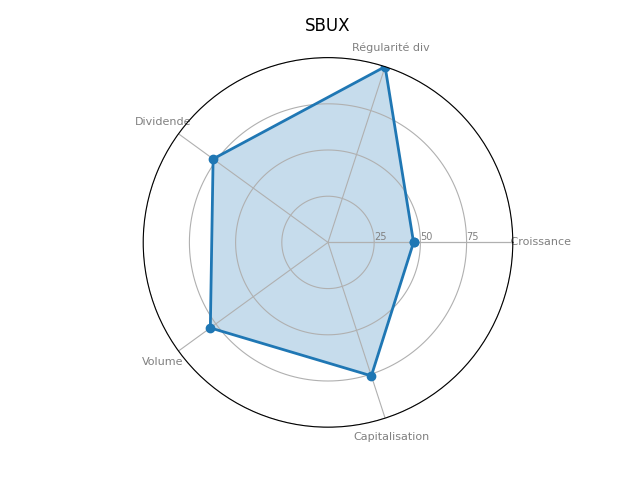
Positionnement boursier de STARBUCKS
Version Beta