| Action | MMA | MACD_MME | Bollinger | Stochastique | RSI | Chandelier |
|---|---|---|---|---|---|---|
| COSTAR GROUP | RAS | RAS | RAS | Neutre | Signal ↑↑↑ : 11.44% | Neutre | Englobante ↑ |
COSTAR GROUP : 89.26
| 1j | 5j | 1m | 3m | 1a |
|---|---|---|---|---|
| 1.58% | 0% | 0% | 0% | 5.38% |
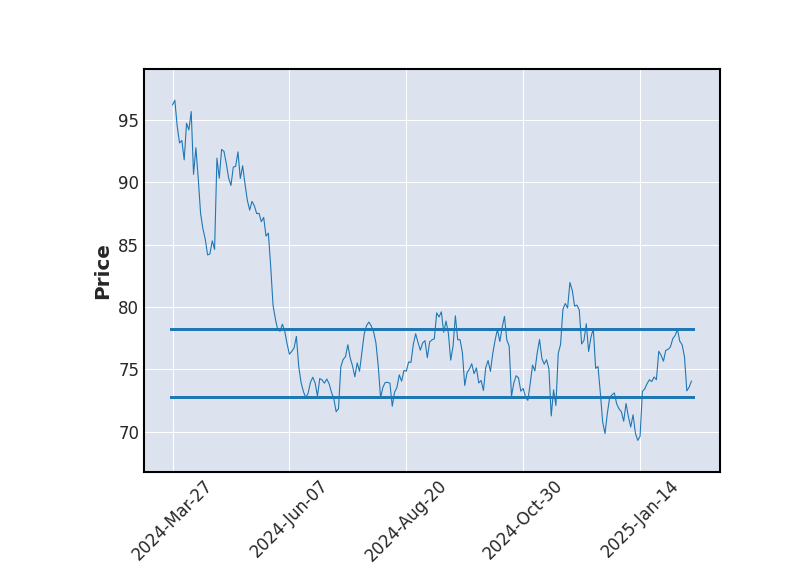
Evolution annuelle
Min : 84.26Moy : 90.25Max : 97.43
|
89.26
| Court terme | Moyen terme | Long terme |
|---|---|---|
 | |  |


Analyse Boursicot du 18/09/2025
Graphique boursier
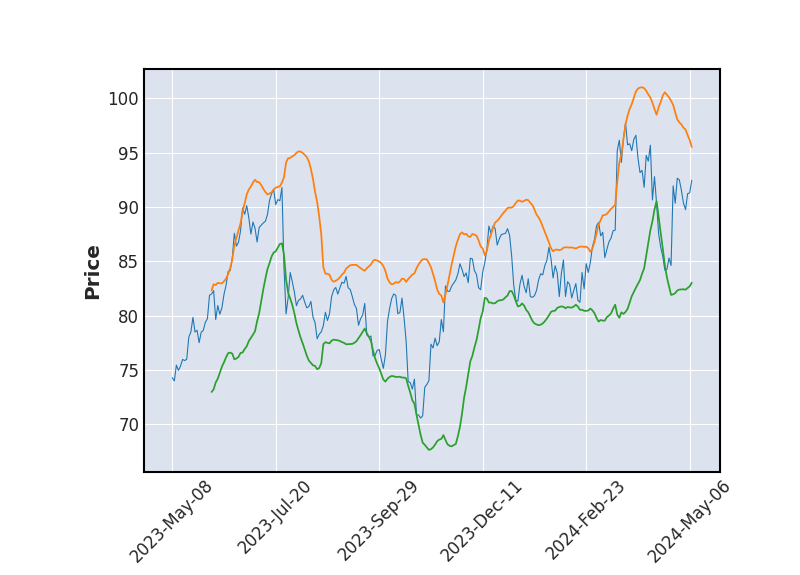 Bollinger
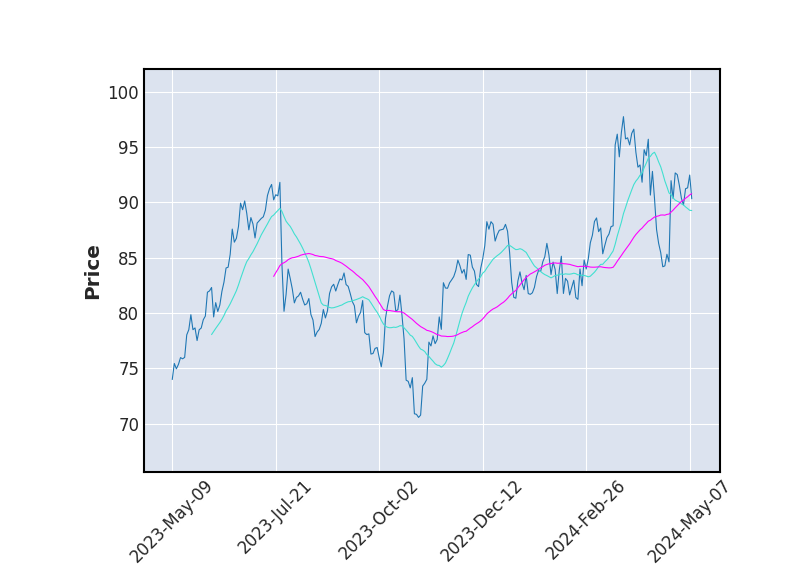 Moyenne Mobile
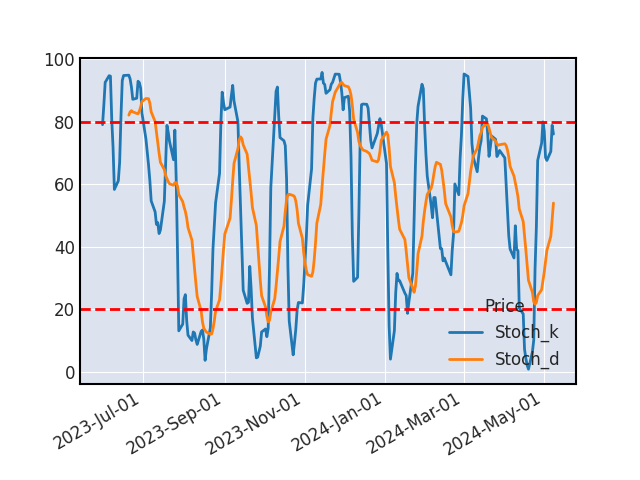 Stochastique
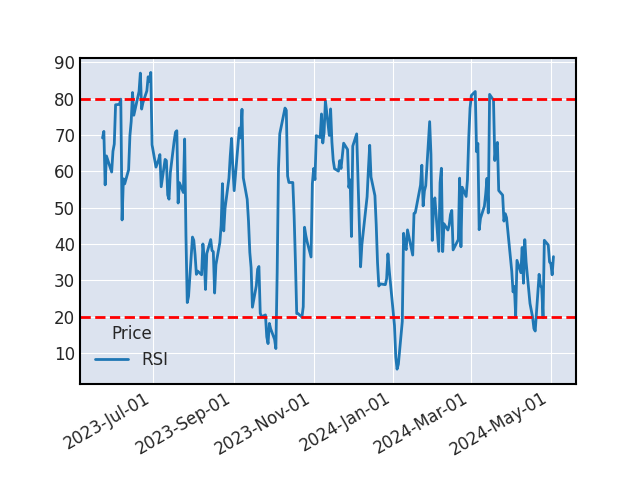 RSI
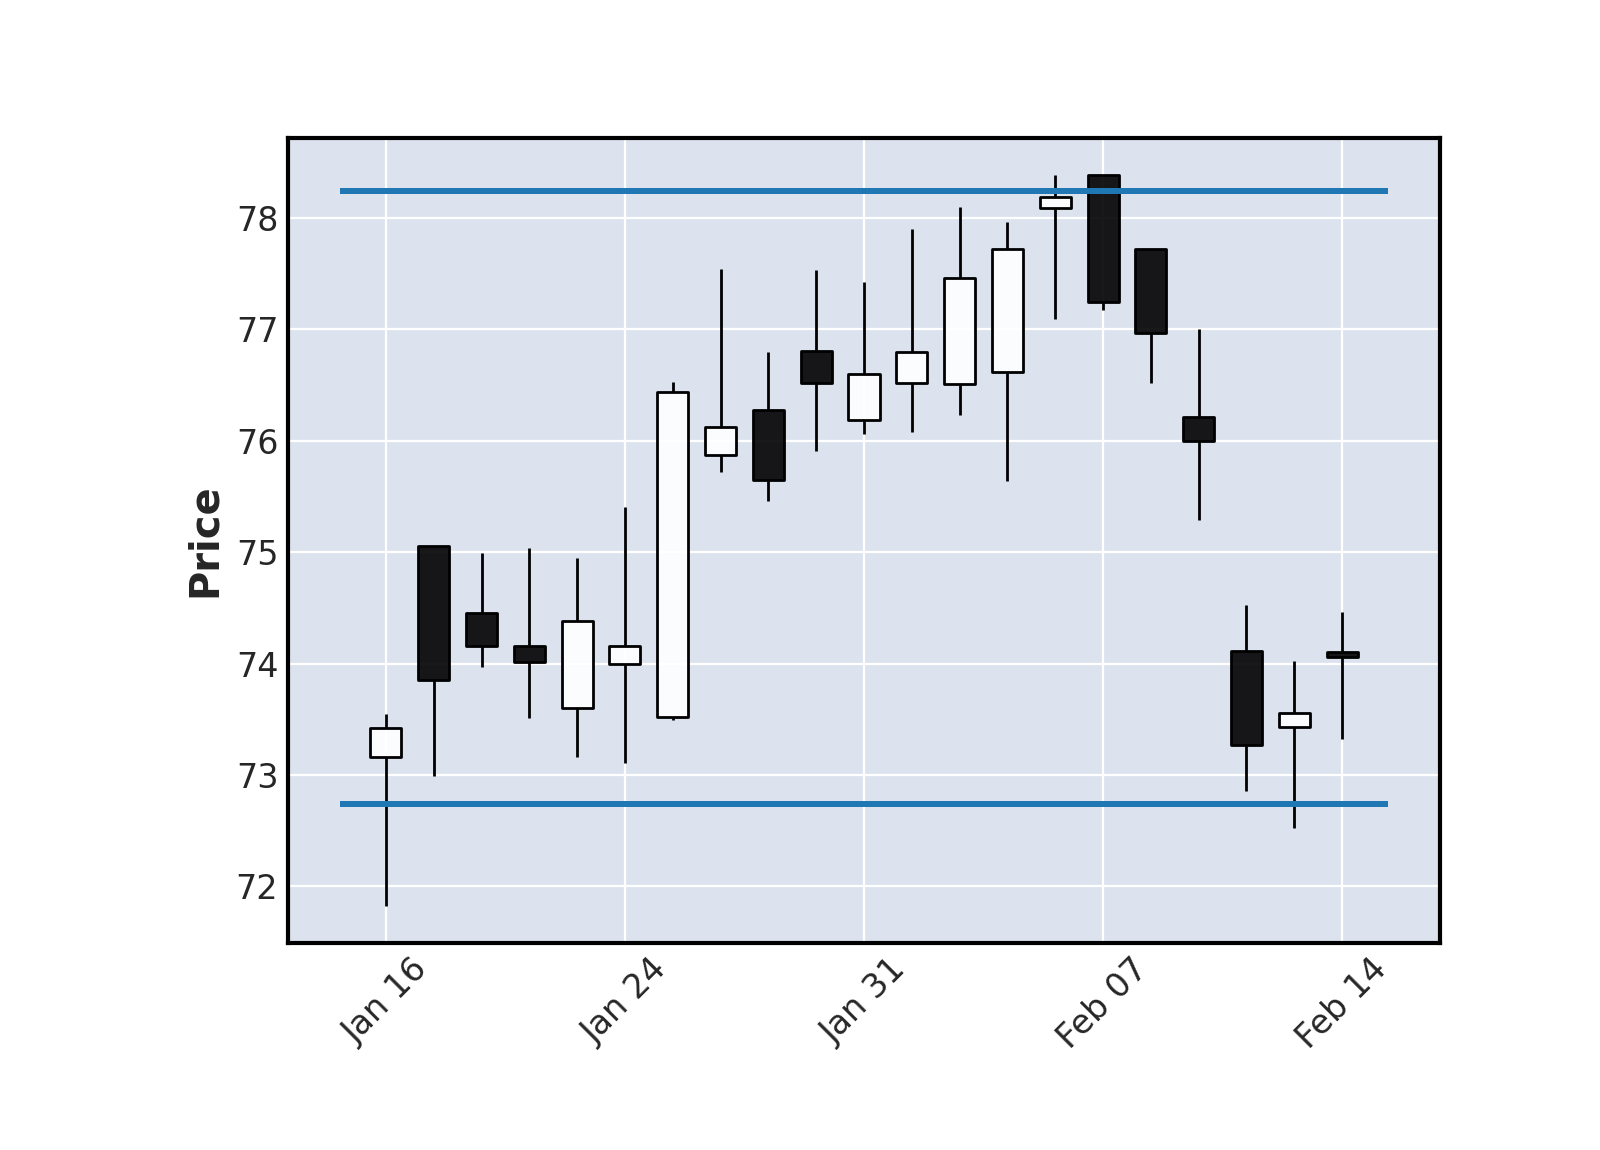
RSIChandeliers japonais (Englobante ↑)
Un retournement haussier devrait se produire dans les prochaines séances suite à l'apparition de cette figure.
STOCHASTIQUE
Le stochastique et son signal viennent de se croiser, indiquant une hausse à venir sur le titre (il est recommandé de valider ce signal haussier par un indicateur complémentaire).
SUPPORTS ET RESISTANCES
| Support Résistance | Rebond | Ecart avec le cours |
|---|---|---|
| 79.54 | 5 | -10.88% |
| 73.34 | 11 | -17.84% |
Historique de cours - COSTAR GROUP
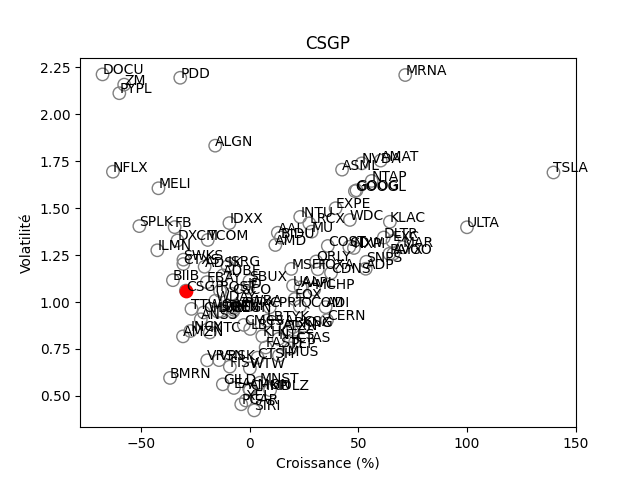
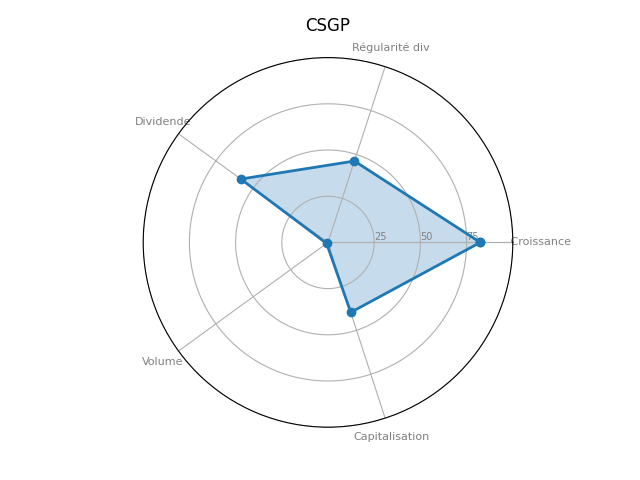
Positionnement boursier de COSTAR GROUP
Version Beta