| Action | MMA | MACD_MME | Bollinger | Stochastique | RSI | Chandelier |
|---|---|---|---|---|---|---|
| UNITED AIRLINES | RAS | RAS | RAS | Neutre | RAS | Neutre | RAS |
UNITED AIRLINES : 105.38
| 1j | 5j | 1m | 3m | 1a |
|---|---|---|---|---|
| -0.12% | 0% | 0% | 0% | 34.04% |
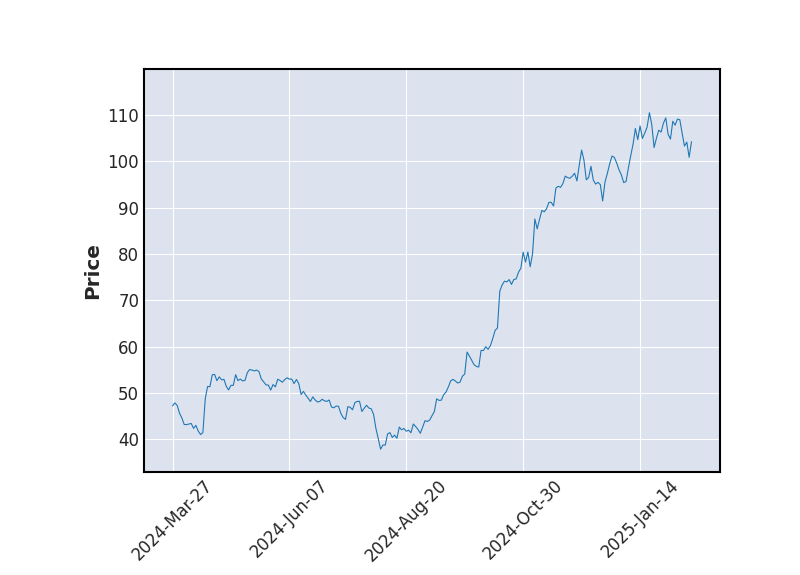
Evolution annuelle
Min : 71.55Moy : 89.34Max : 110.66
|
105.38
| Court terme | Moyen terme | Long terme |
|---|---|---|
 | |  |


Analyse Boursicot du 18/09/2025
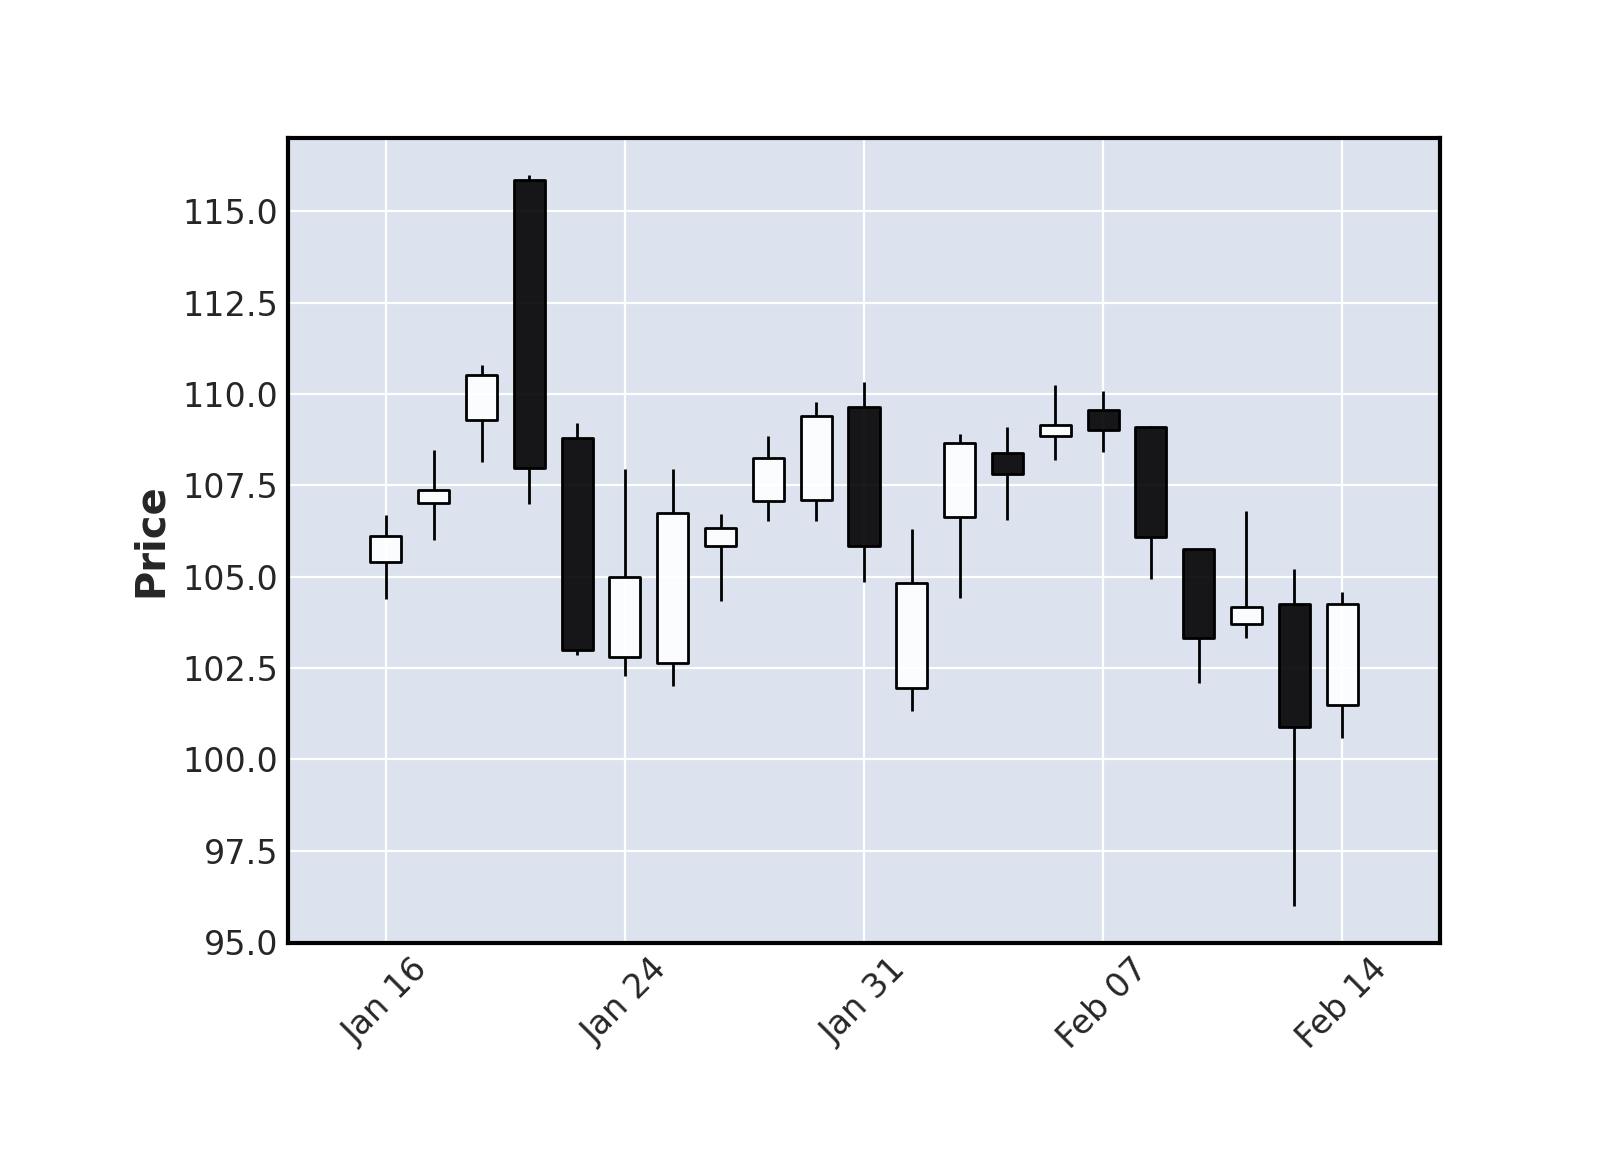
Graphique boursier
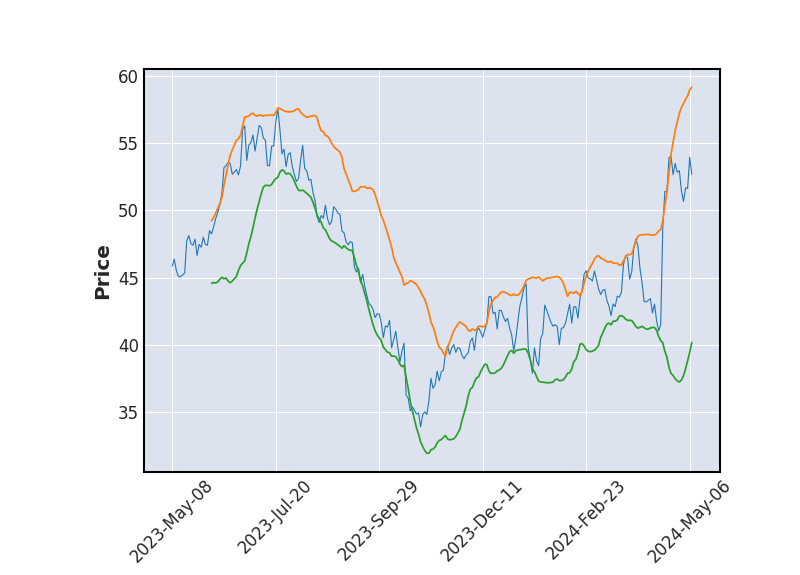 Bollinger
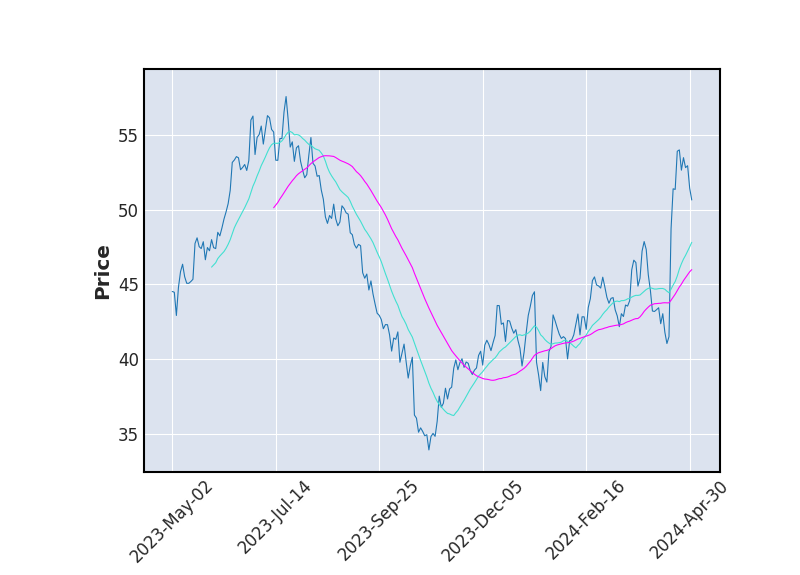 Moyenne Mobile
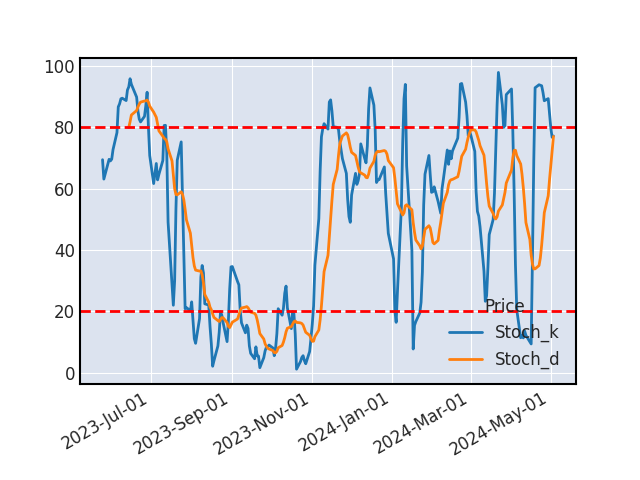 Stochastique
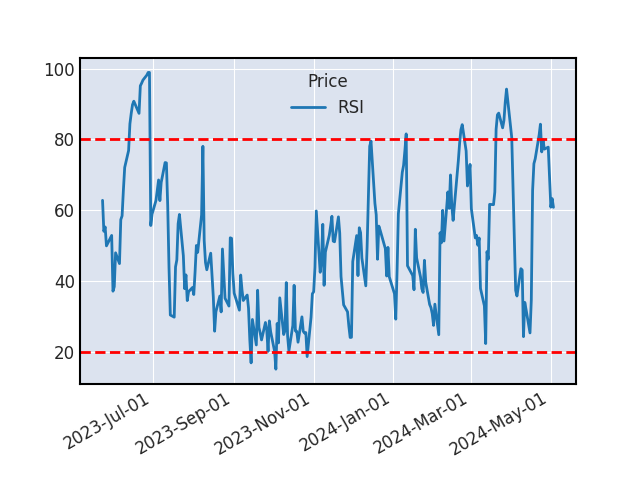 RSI
RSIL'analyse technique n'a pas permis d'identifier d'évolution à la hausse ou à la baisse.
SUPPORTS ET RESISTANCES
| Support Résistance | Rebond | Ecart avec le cours |
|---|---|---|
| 91.57 | 3 | -13.1% |
Historique de cours - UNITED AIRLINES
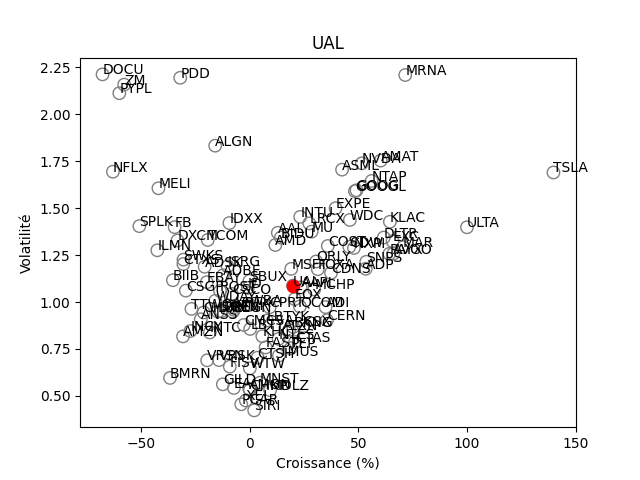
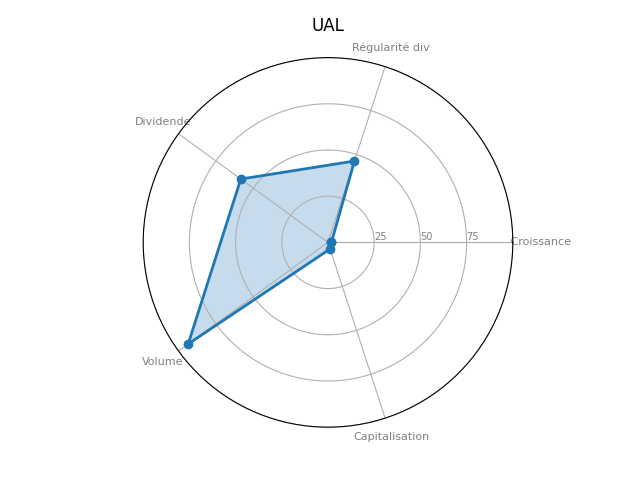
Positionnement boursier de UNITED AIRLINES
Version Beta