| Action | MMA | MACD_MME | Bollinger | Stochastique | RSI | Chandelier |
|---|---|---|---|---|---|---|
| ALSTOM | RAS | RAS | ↓ | Neutre | Signal ↓ : -7.77% | Sur-achat↓ | Englobante ↓ |
ALSTOM : 25.86
| 1j | 5j | 1m | 3m | 1a |
|---|---|---|---|---|
| -3.76% | 0% | 0% | 0% | 24.21% |
Evolution annuelle
Min : 19.36Moy : 22.1Max : 27.09
|
25.86
| Court terme | Moyen terme | Long terme |
|---|---|---|
 | | |


Analyse Boursicot du 06/01/2026
Graphique boursier
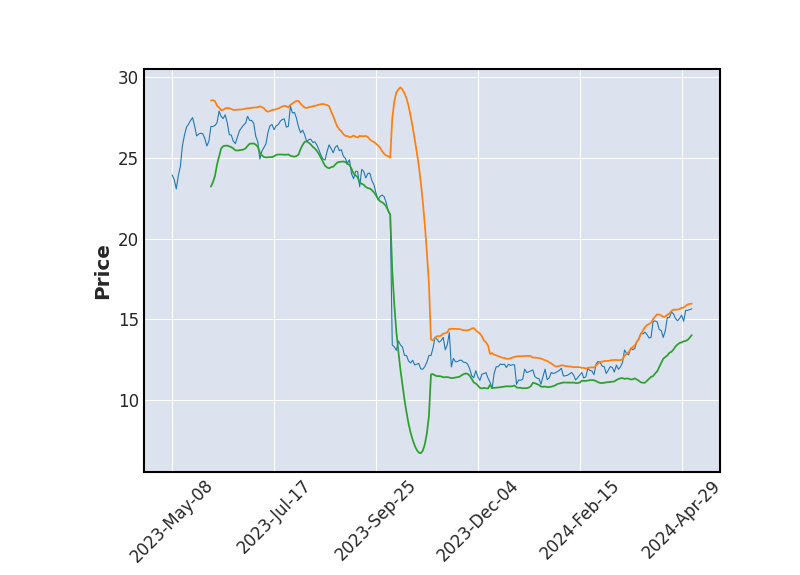 Bollinger
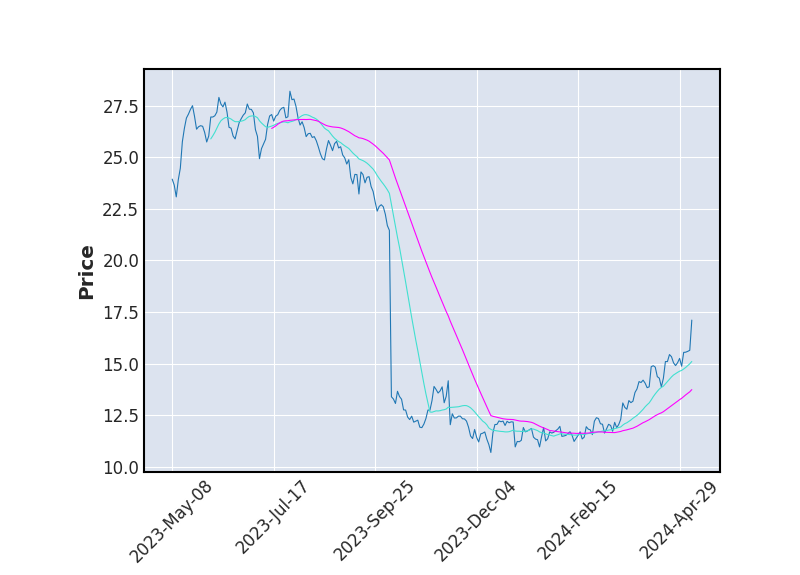 Moyenne Mobile
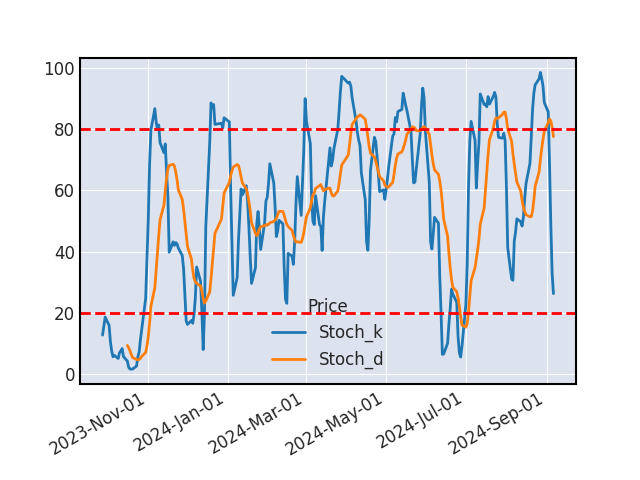 Stochastique
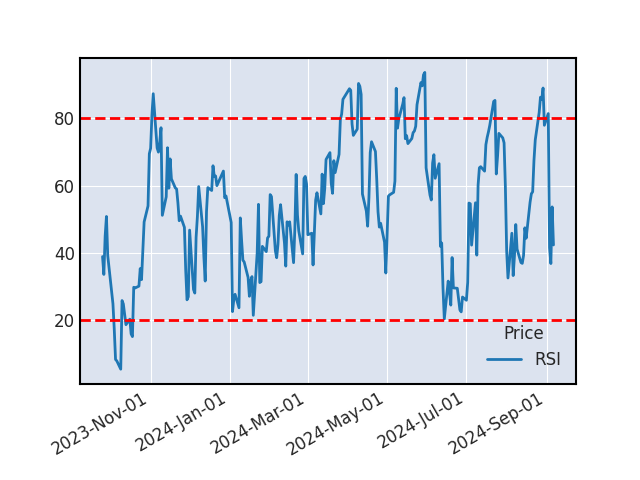 RSI
RSIBOLLINGER
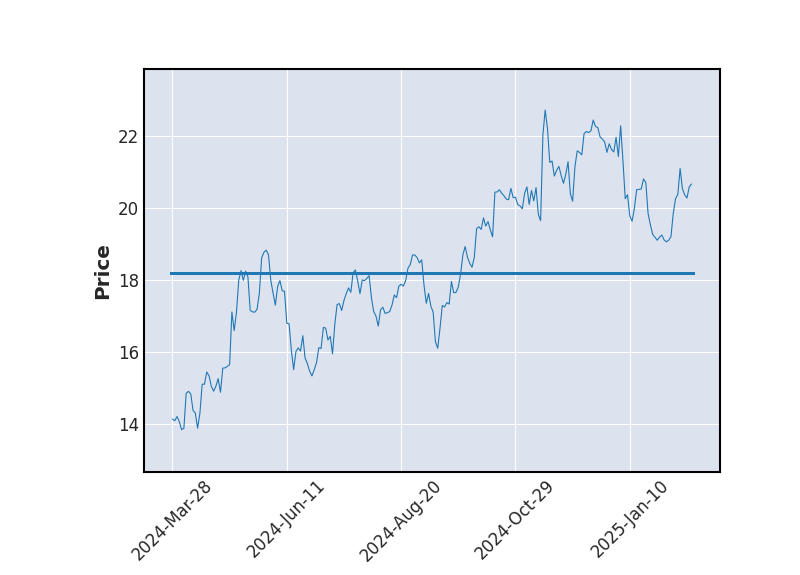
Après être sorti dernièrement des bandes de Bollinger, le cours de l’action vient de les réintégrer laissant présager une baisse à venir.
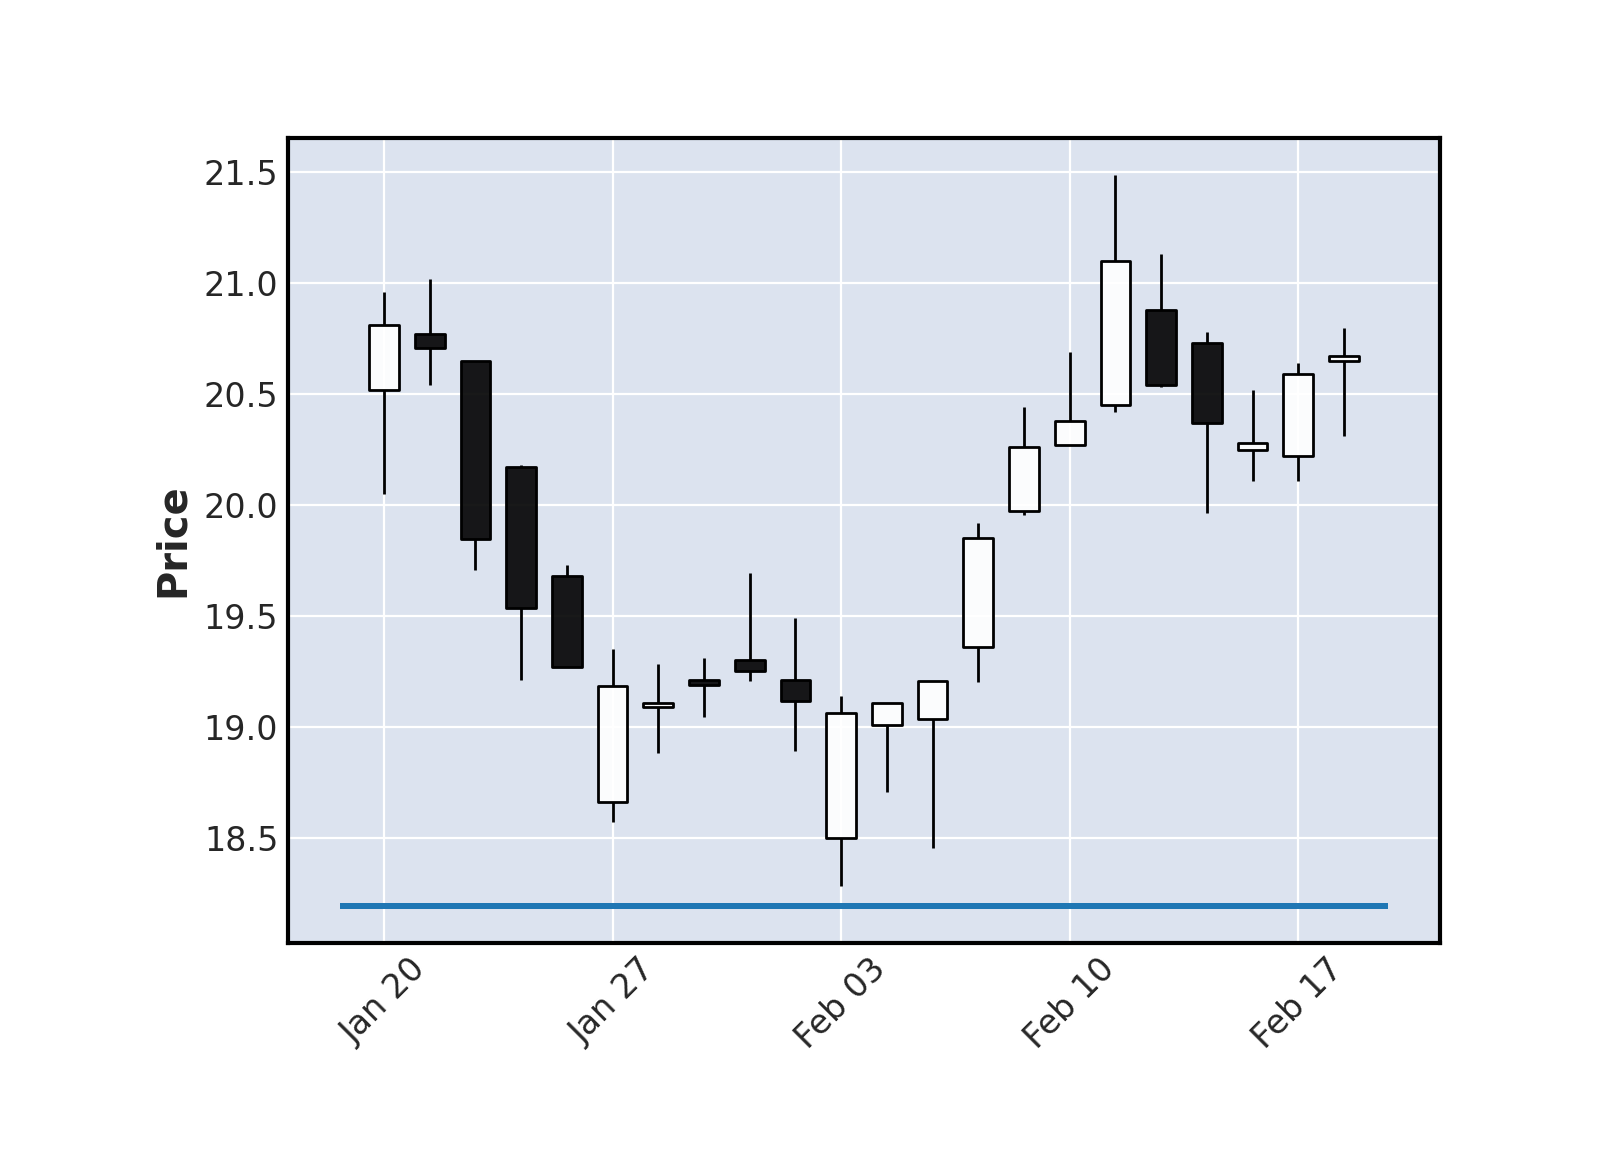
Chandeliers japonais (Englobante ↓)
La figure qui vient de se former sur l’action ALSTOM nous indique un retournement baissier à venir.
STOCHASTIQUE
Le stochastique et son signal se sont croisés, en cas de confirmation par un autre indicateur, ce signal nous indique une baisse à venir du cours.
RSI
Le RSI vient de franchir à la baisse la limite des 80 (zone de sur-achat), constituant un signal de baisse sur le cours ALSTOM.
VOLUME
Nous constatons plus de 50% d'échange de moins que d'habitude sur le titre.
SUPPORTS ET RESISTANCES
| Support Résistance | Rebond | Ecart avec le cours |
|---|---|---|
| 20.85 | 3 | -19.37% |
| 19.68 | 6 | -23.92% |
| 19.08 | 3 | -26.24% |
Historique de cours - ALSTOM
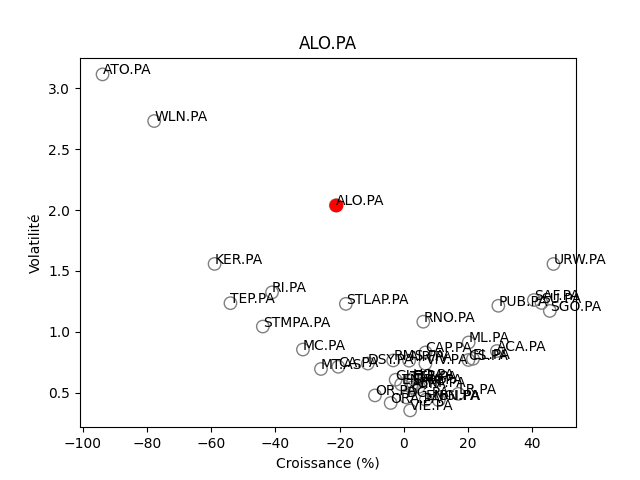
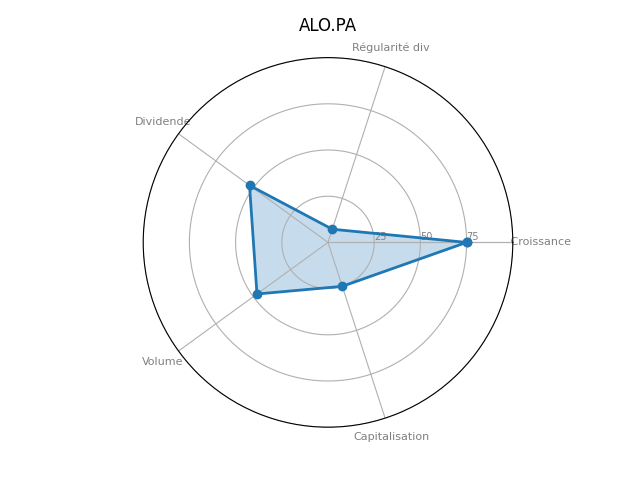
Positionnement boursier de ALSTOM