| Action | MMA | MACD_MME | Bollinger | Stochastique | RSI | Chandelier |
|---|---|---|---|---|---|---|
| ARKEMA | RAS | RAS | RAS | Sur-vente↑ | Signal ↑ : 3.18% | Neutre | RAS |
ARKEMA : 56.1
| 1j | 5j | 1m | 3m | 1a |
|---|---|---|---|---|
| 2.94% | 2.65% | -2.26% | -7.12% | -12.14% |
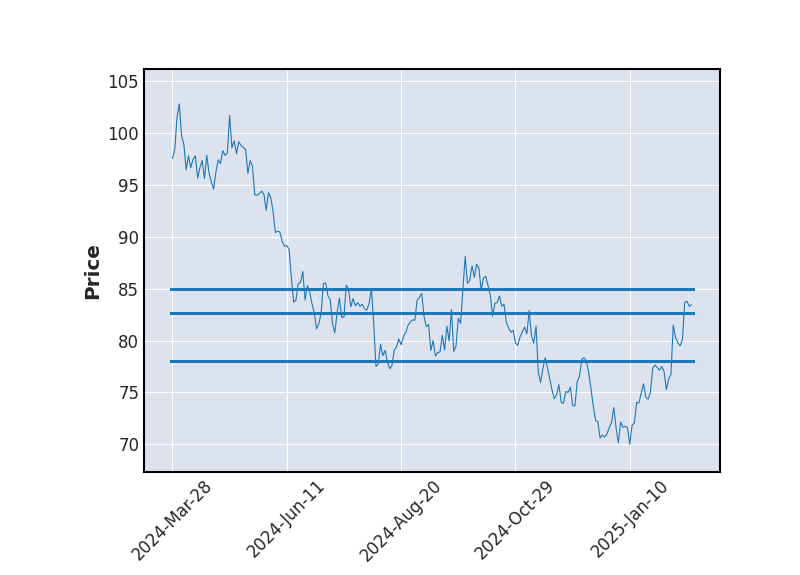
Evolution annuelle
Min : 48.3Moy : 56.7Max : 67.05
|
56.1
| Court terme | Moyen terme | Long terme |
|---|---|---|
 | |  |


Analyse Boursicot du 13/07/2026
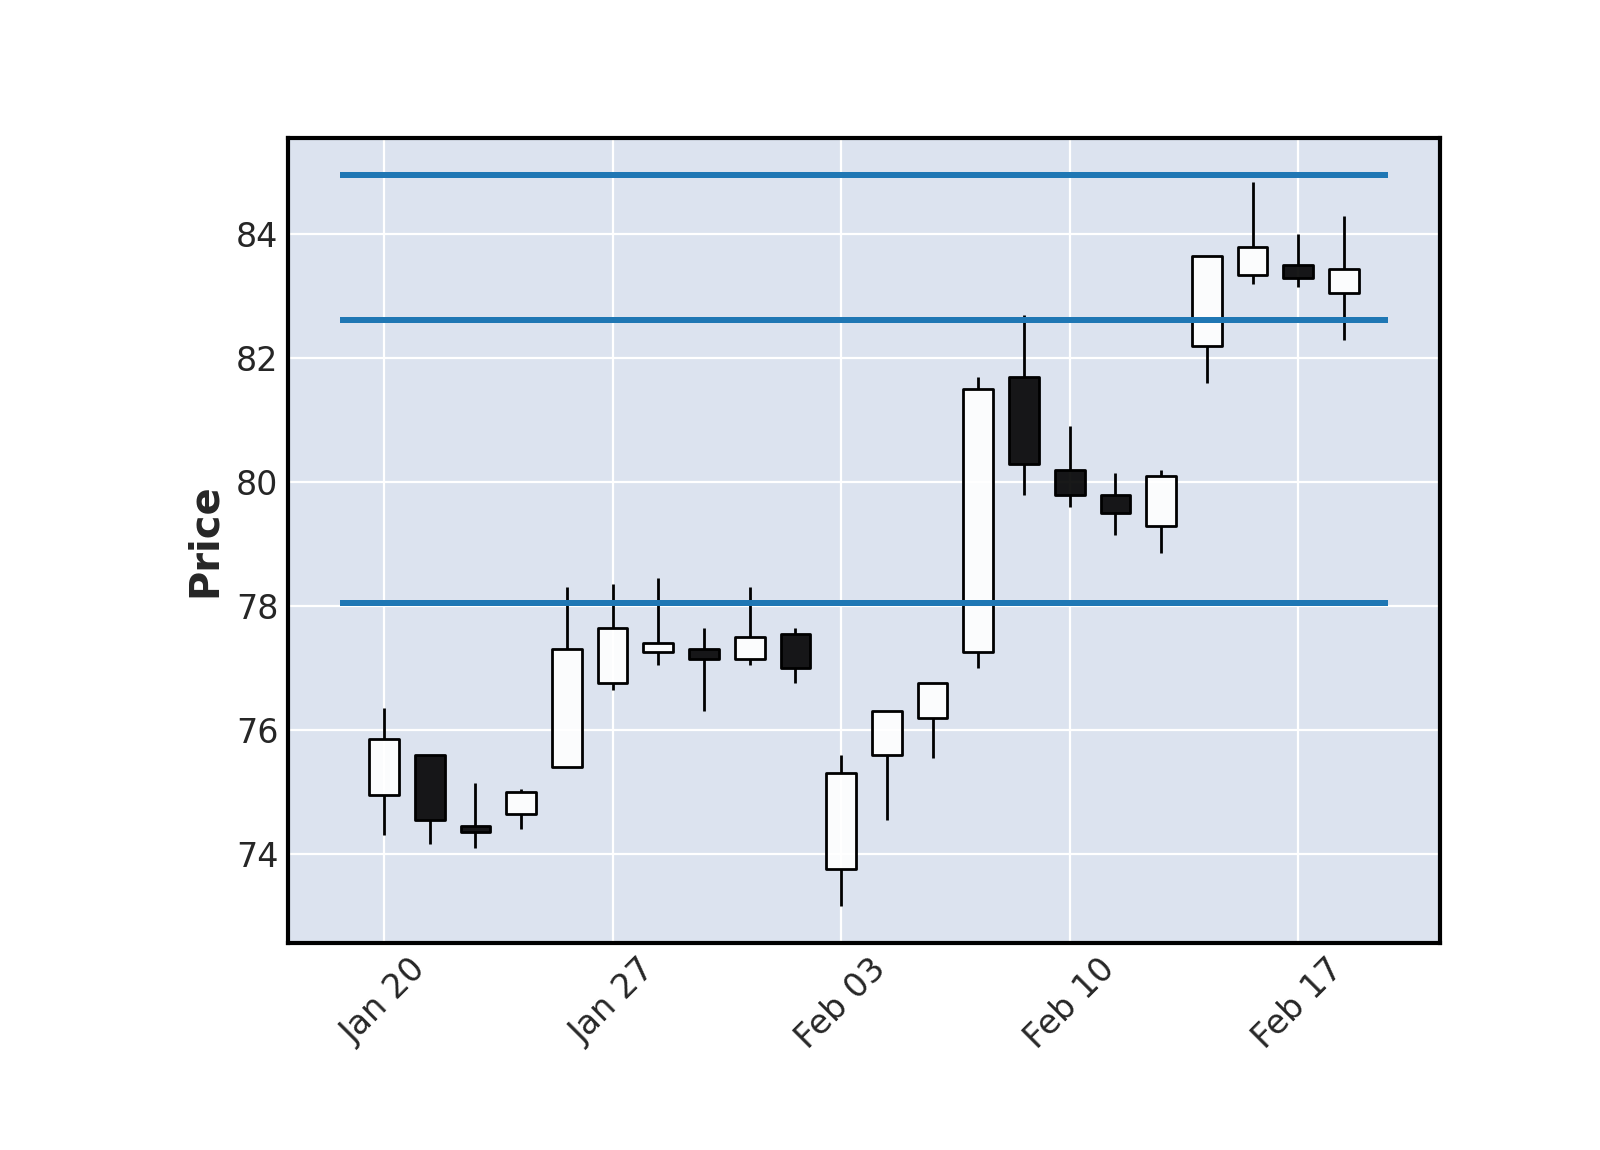
Graphique boursier
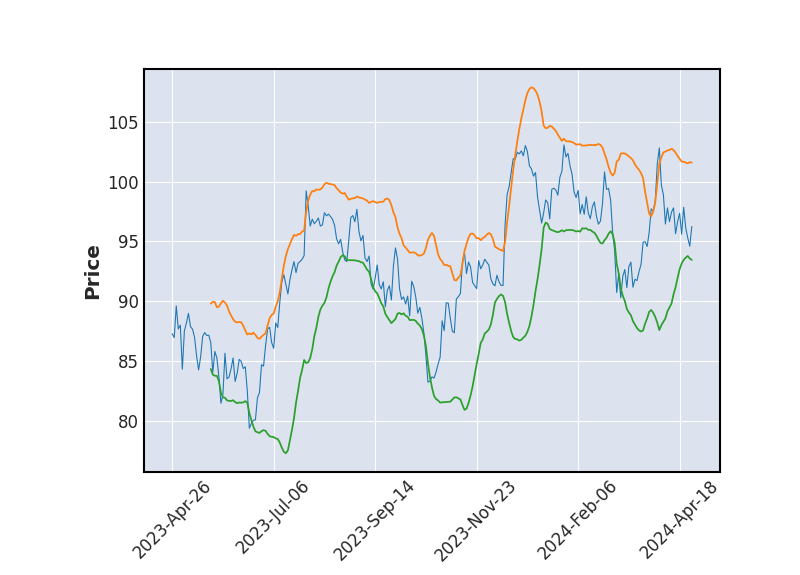 Bollinger
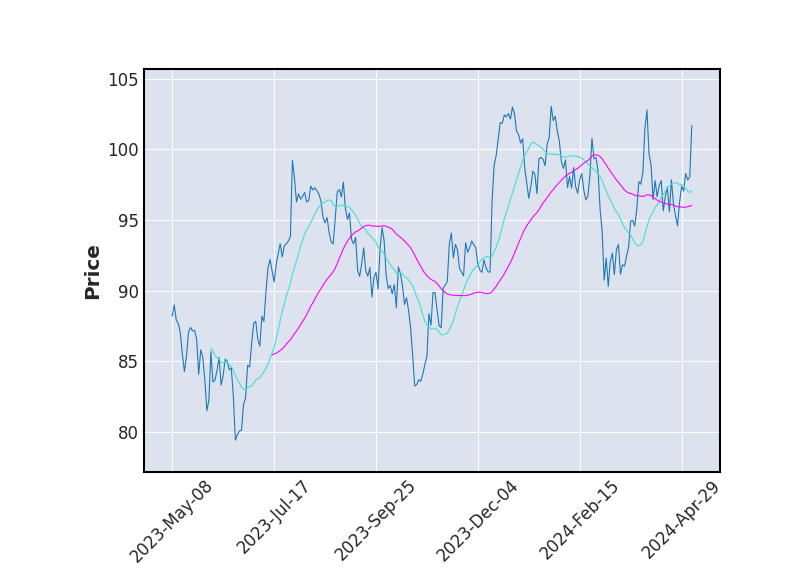 Moyenne Mobile
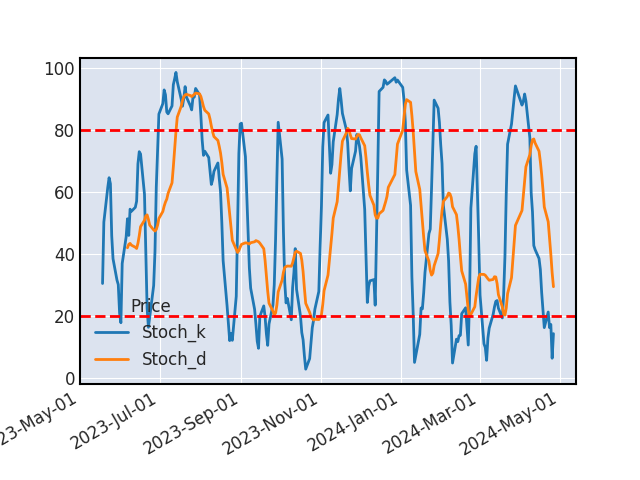 Stochastique
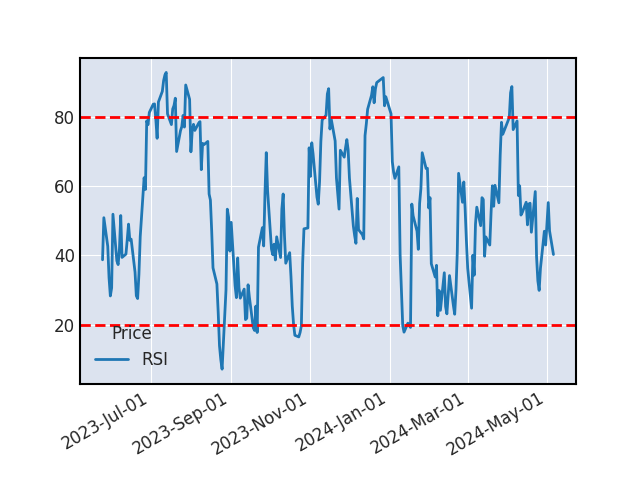 RSI
RSISTOCHASTIQUE
Le stochastique vient de sortir de la zone de sur-vente indiquant une hausse à venir sur le titre ARKEMA. Le stochastique et son signal se sont croisés, en cas de confirmation par un autre indicateur, ce signal nous indique une hausse à venir du cours.
SUPPORTS ET RESISTANCES
| Support Résistance | Rebond | Ecart avec le cours |
|---|---|---|
| 65.22 | 3 | 16.25% |
| 61.87 | 4 | 10.28% |
| 59.17 | 4 | 5.47% |
| 57.38 | 3 | 2.27% |
| 53.35 | 5 | -4.9% |
| 52.18 | 3 | -7.0% |
| 50.42 | 3 | -10.12% |
| 49.13 | 3 | -12.42% |
Historique de cours - ARKEMA
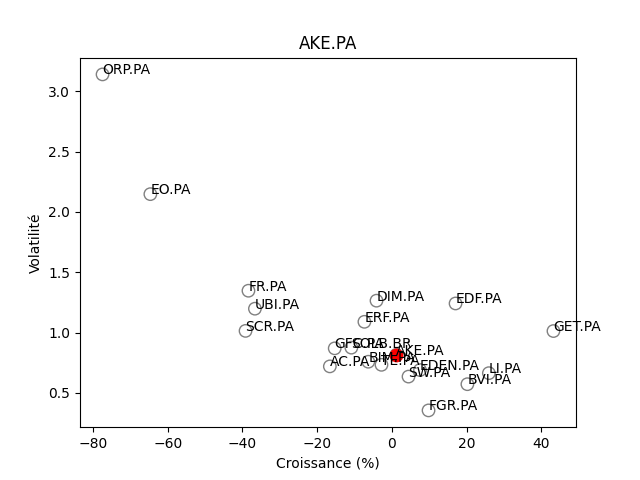
Positionnement boursier de ARKEMA

Version Beta