| Action | MMA | MACD_MME | Bollinger | Stochastique | RSI | Chandelier |
|---|---|---|---|---|---|---|
| SARTORIUS STEDIM BIOTECH | RAS | RAS | RAS | Neutre | RAS | Neutre | RAS |
SARTORIUS STEDIM BIOTECH : 189.3
| 1j | 5j | 1m | 3m | 1a |
|---|---|---|---|---|
| 3.27% | 9.17% | 7.8% | 4.7% | -3.66% |
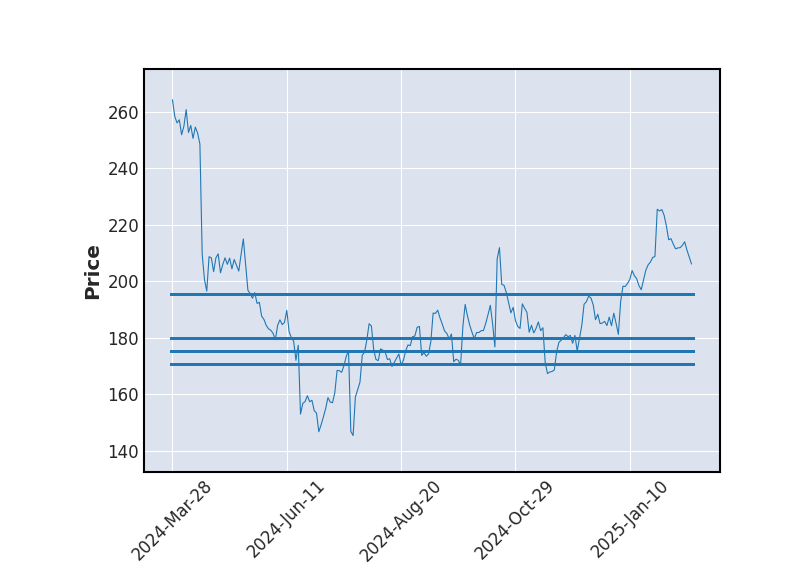
Evolution annuelle
Min : 150Moy : 183.53Max : 224
|
189.3
| Court terme | Moyen terme | Long terme |
|---|---|---|
 | |  |


Analyse Boursicot du 13/07/2026
Graphique boursier
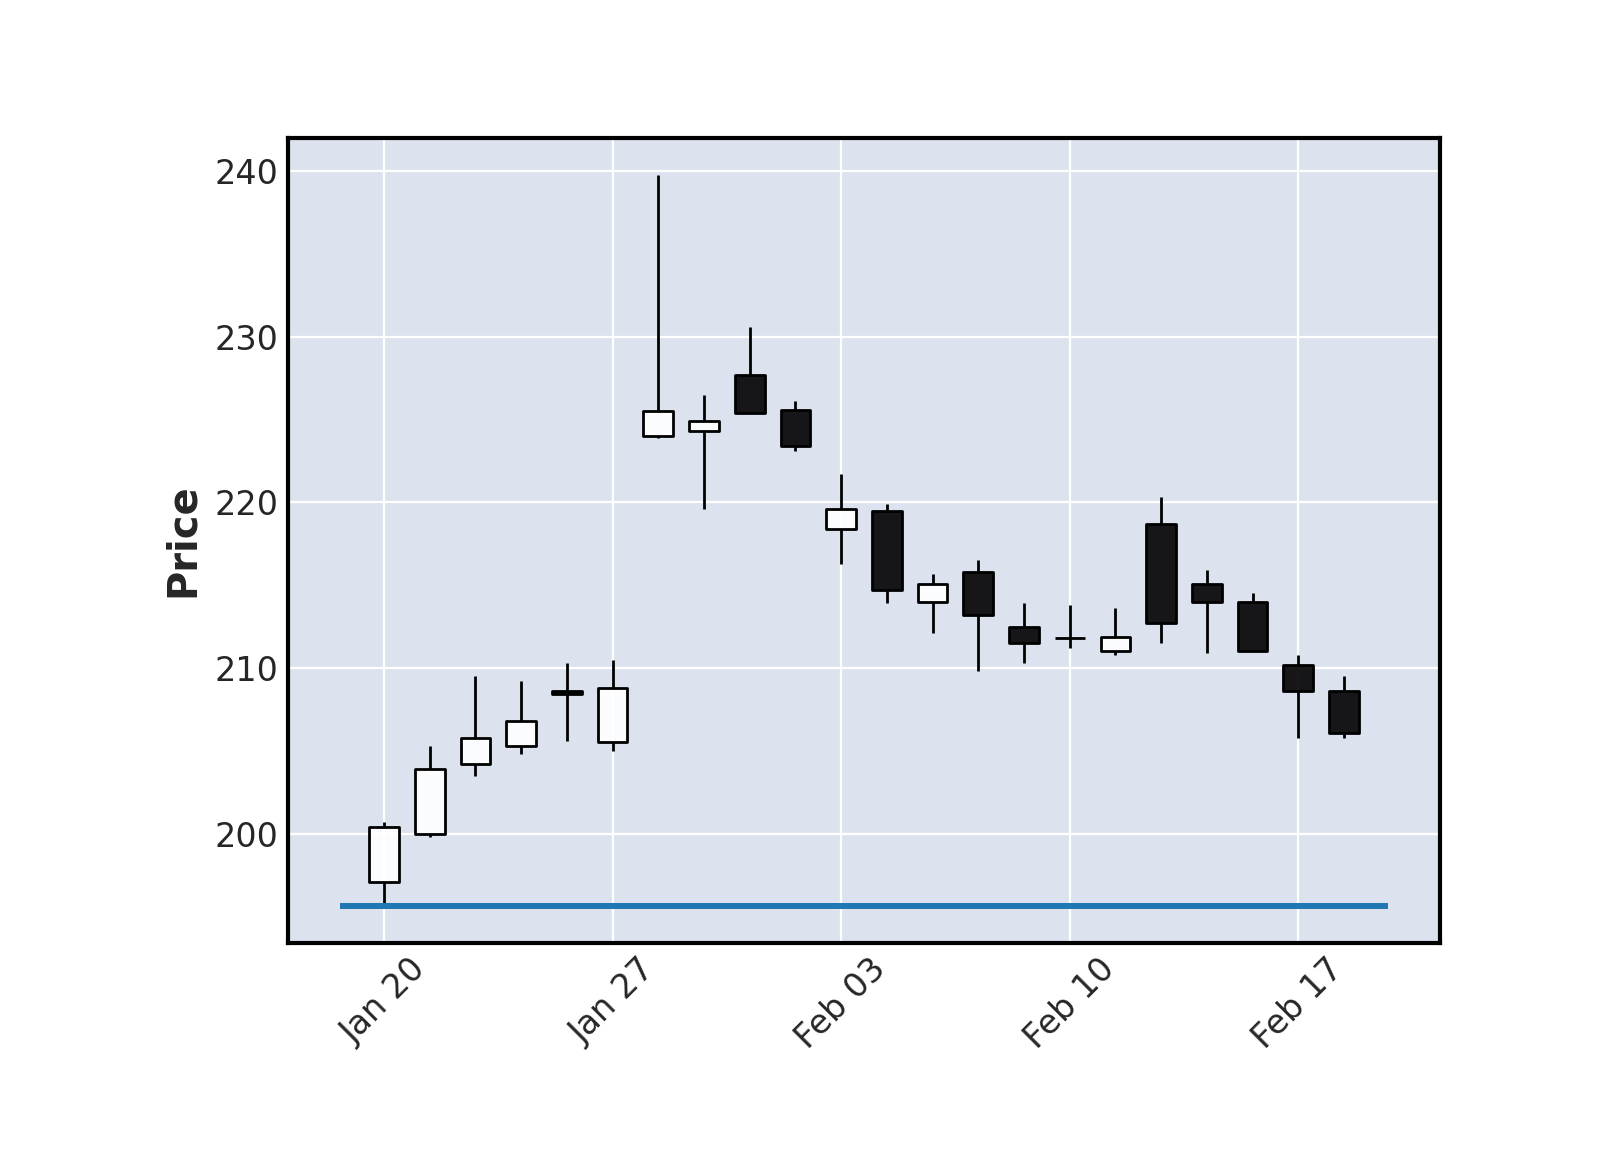
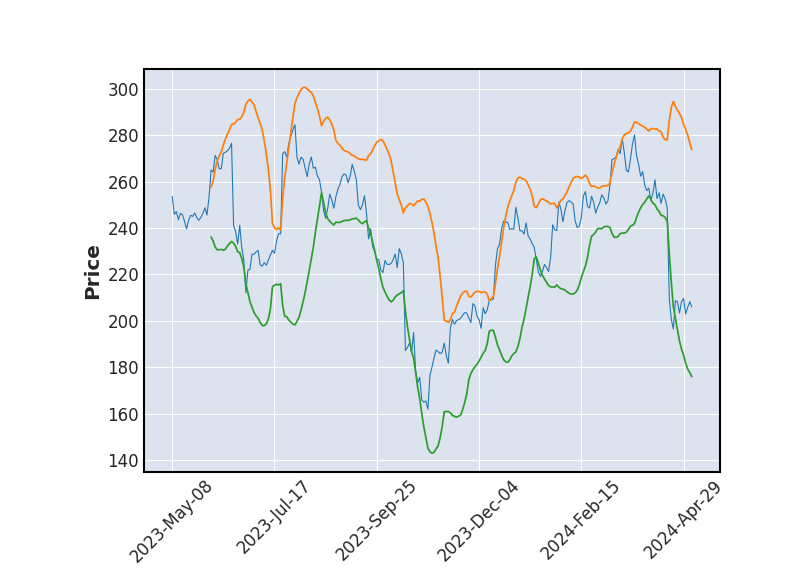 Bollinger
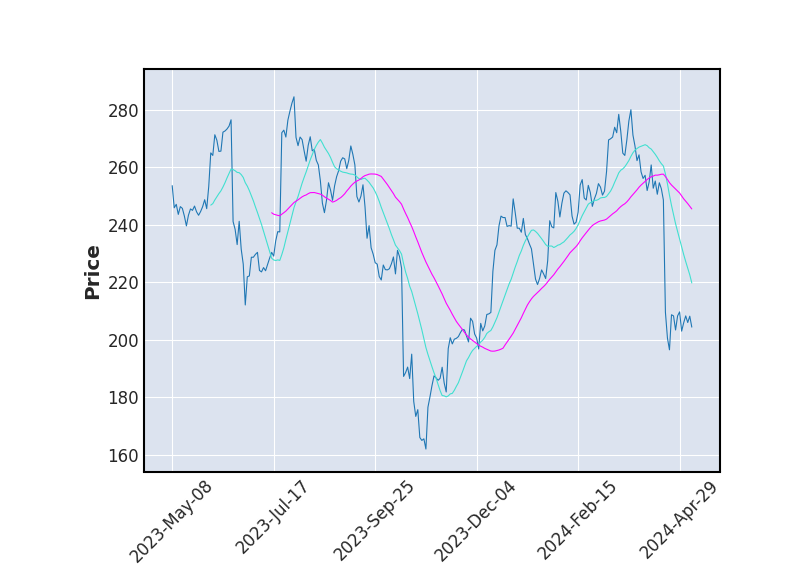 Moyenne Mobile
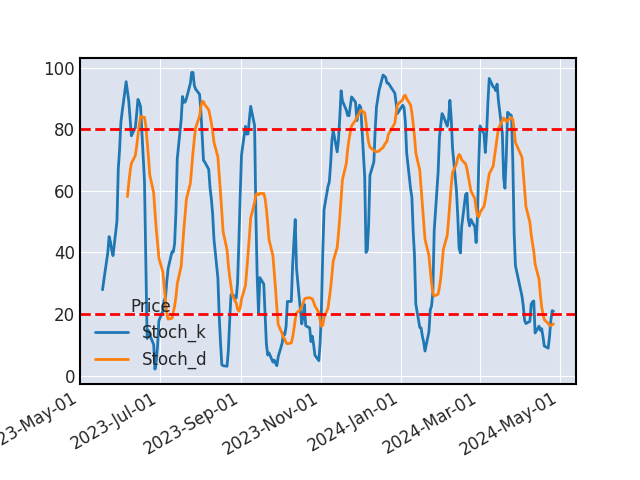 Stochastique
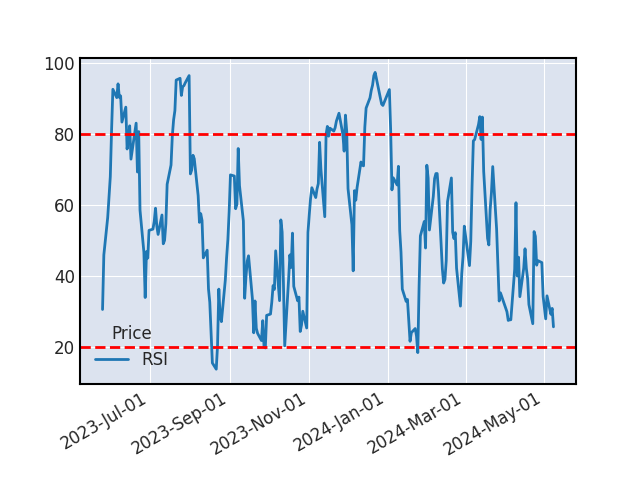 RSI
RSILe titre ne donne aucun signal d'achat ou de vente.
SUPPORTS ET RESISTANCES
| Support Résistance | Rebond | Ecart avec le cours |
|---|---|---|
| 187.2 | 3 | -1.11% |
| 182.94 | 5 | -3.36% |
| 178.65 | 3 | -5.63% |
| 166.98 | 4 | -11.79% |
Historique de cours - SARTORIUS STEDIM BIOTECH
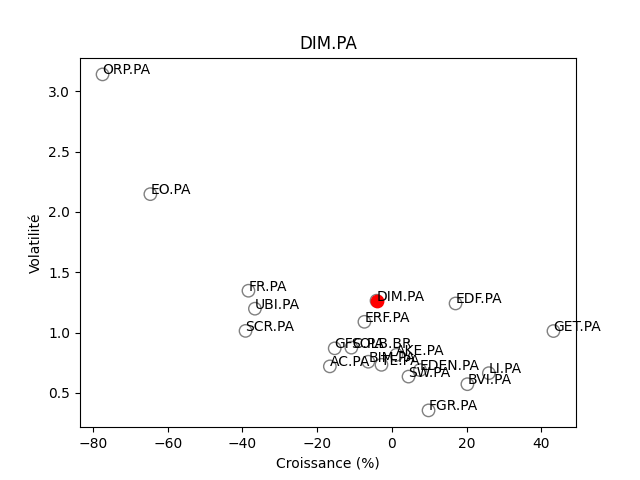
Positionnement boursier de SARTORIUS STEDIM BIOTECH

Version Beta