| Action | MMA | MACD_MME | Bollinger | Stochastique | RSI | Chandelier |
|---|---|---|---|---|---|---|
| AMUNDI NASDAQ-100 ETF-C EUR | Signal ↓↓↓ : -0.0037% | RAS | RAS | Neutre | Signal ↓↓ : -27.01% | Neutre | RAS |
AMUNDI NASDAQ-100 ETF-C EUR : 280.8
| 1j | 5j | 1m | 3m | 1a |
|---|---|---|---|---|
| -1.54% | -1.7% | -4.6% | 5.66% | 20.88% |
Evolution annuelle
Min : 223.5Moy : 255.23Max : 306.7
|
280.8
| Court terme | Moyen terme | Long terme |
|---|---|---|
 | |  |


Analyse Boursicot du 27/07/2026
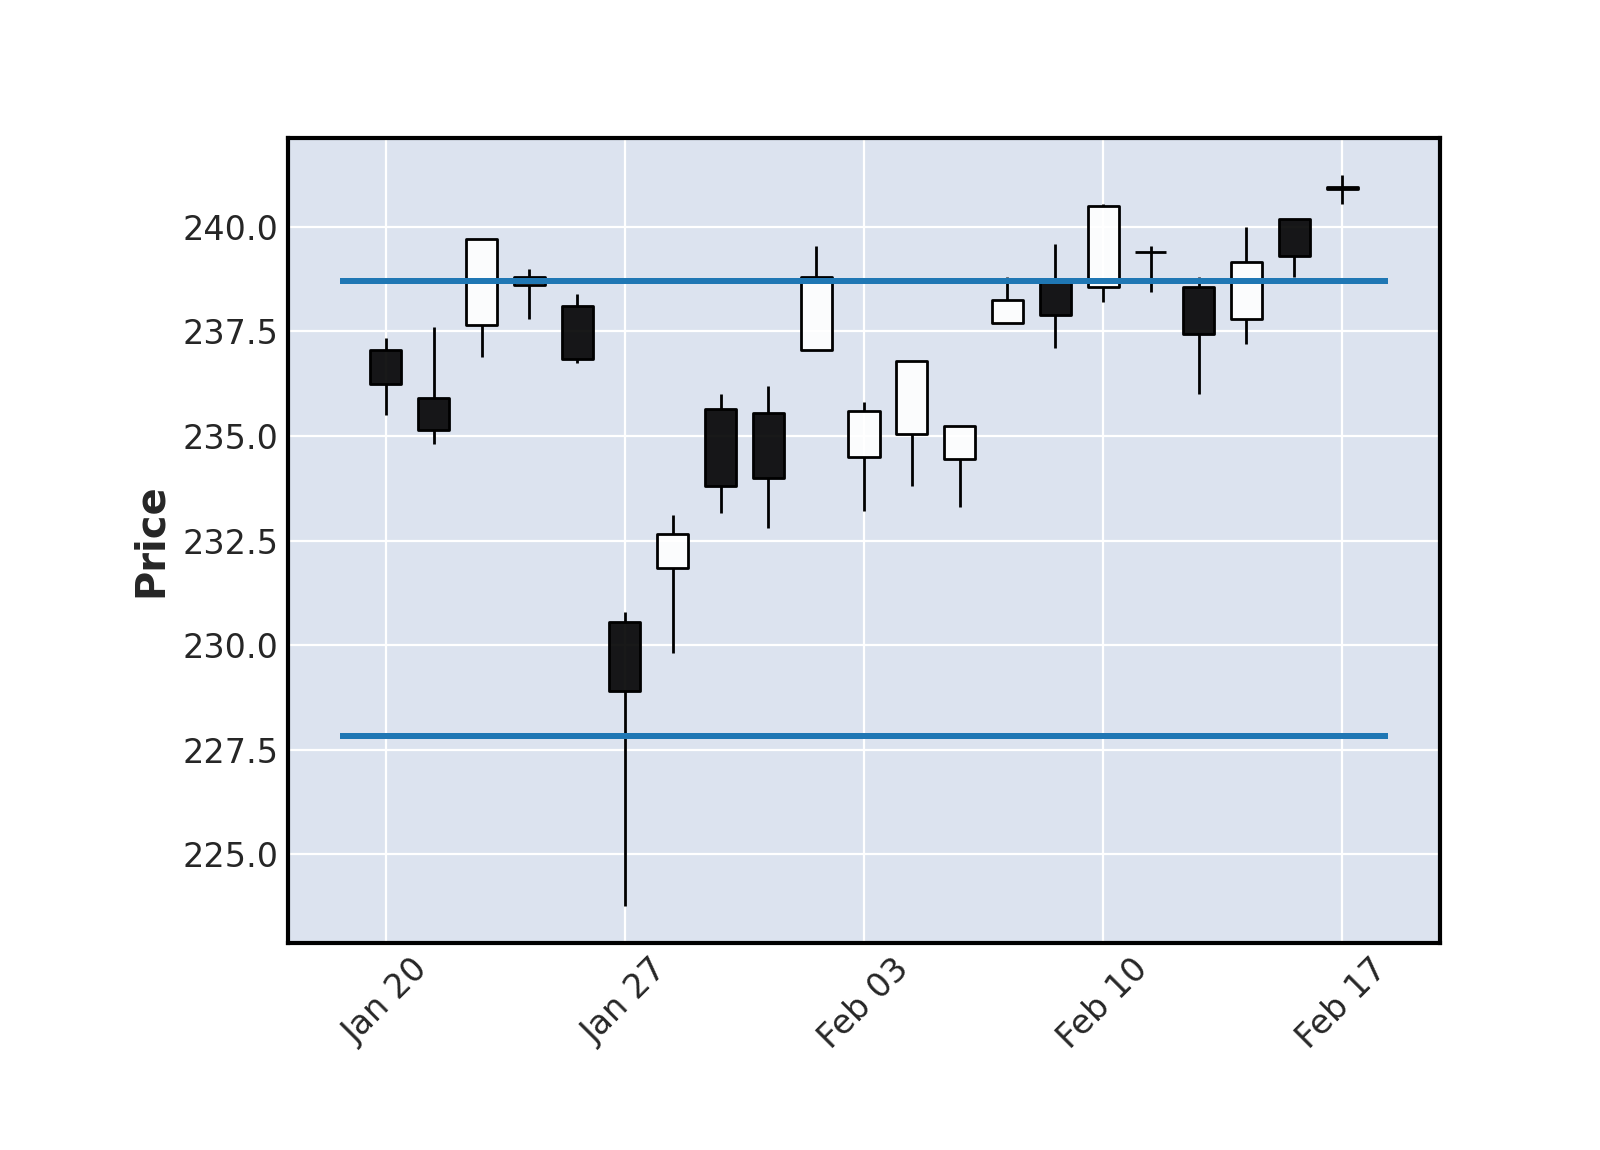
Graphique boursier
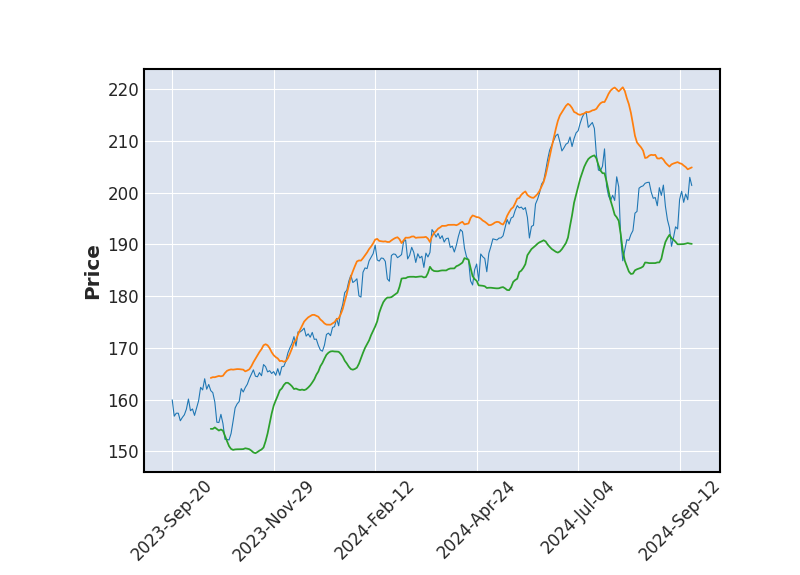 Bollinger
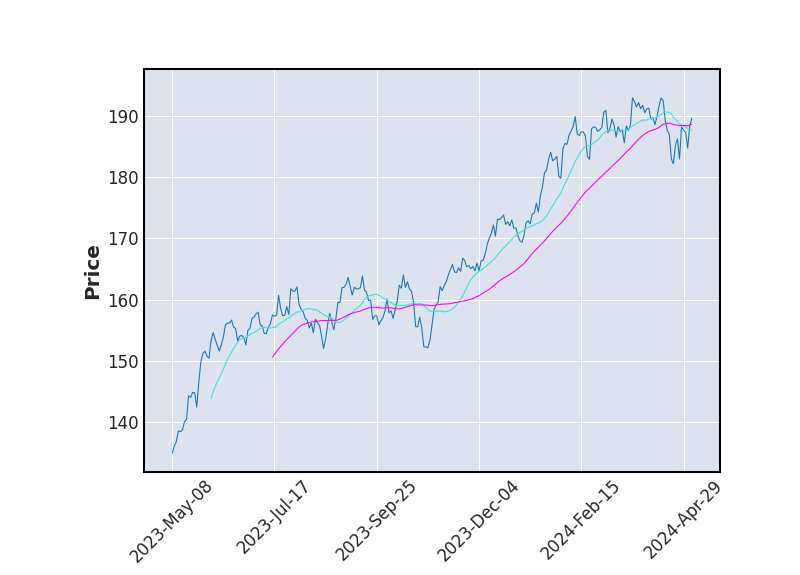 Moyenne Mobile
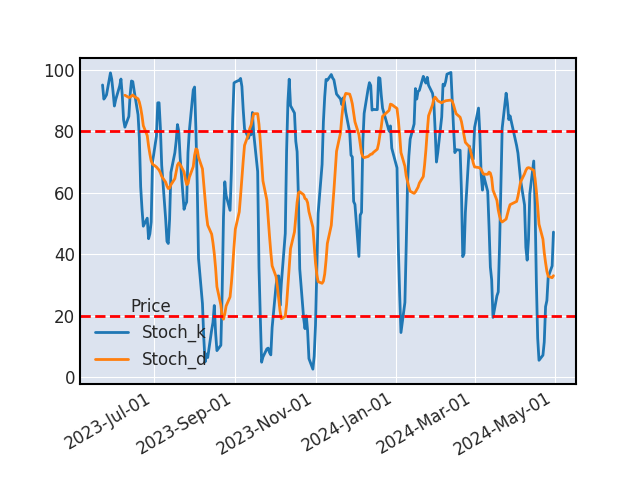 Stochastique
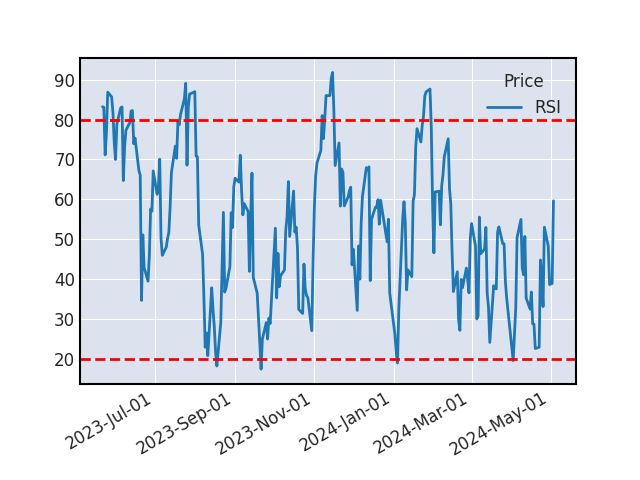 RSI
RSIMMA
L'écart entre les moyennes mobiles 20 et 50 se confirme depuis le croisement il y a 2 jours. La baisse devrait donc se poursuivre.
STOCHASTIQUE
Le stochastique et son signal viennent de se croiser, indiquant une baisse à venir sur le titre (il est recommandé de valider ce signal baissier par un indicateur complémentaire).
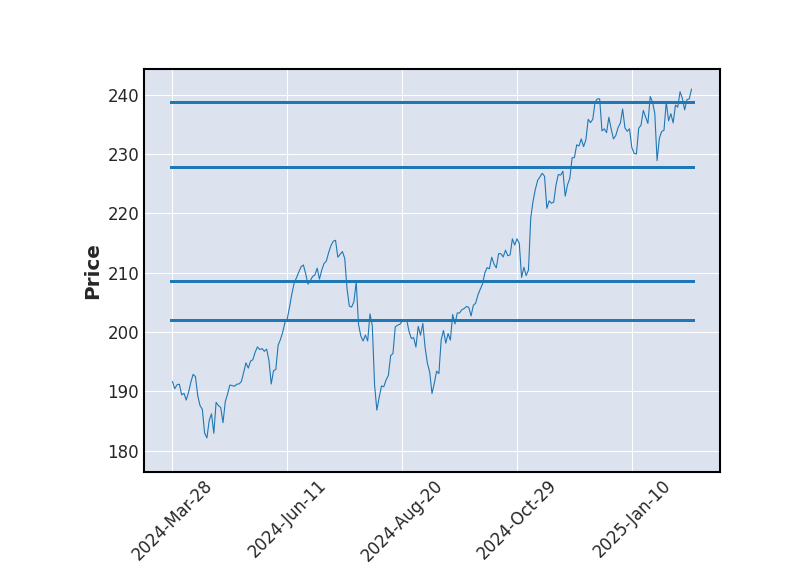
SUPPORTS ET RESISTANCES
| Support Résistance | Rebond | Ecart avec le cours |
|---|---|---|
| 302.62 | 3 | 7.77% |
| 245.99 | 6 | -12.4% |
| 239.25 | 4 | -14.8% |
Historique de cours - AMUNDI NASDAQ-100 ETF-C EUR
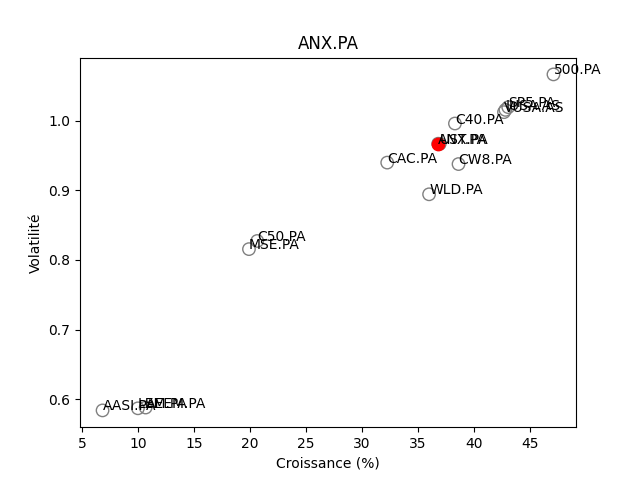
Positionnement boursier de AMUNDI NASDAQ-100 ETF-C EUR

Version Beta