| Action | MMA | MACD_MME | Bollinger | Stochastique | RSI | Chandelier |
|---|---|---|---|---|---|---|
| AMUNDI MSCI EM ASIA UCITS ETF-C EUR | RAS | RAS | RAS | Neutre | RAS | Neutre | RAS |
AMUNDI MSCI EM ASIA UCITS ETF-C EUR : 54.95
| 1j | 5j | 1m | 3m | 1a |
|---|---|---|---|---|
| -1.4% | -2.38% | -7.34% | 4.05% | 33.99% |
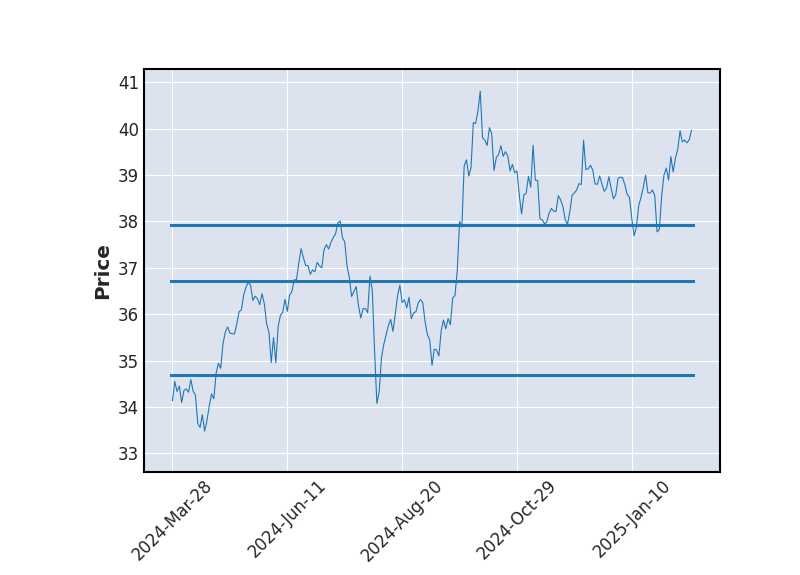
Evolution annuelle
Min : 39.78Moy : 48.89Max : 63.65
|
54.95
| Court terme | Moyen terme | Long terme |
|---|---|---|
 | |  |


Analyse Boursicot du 27/07/2026
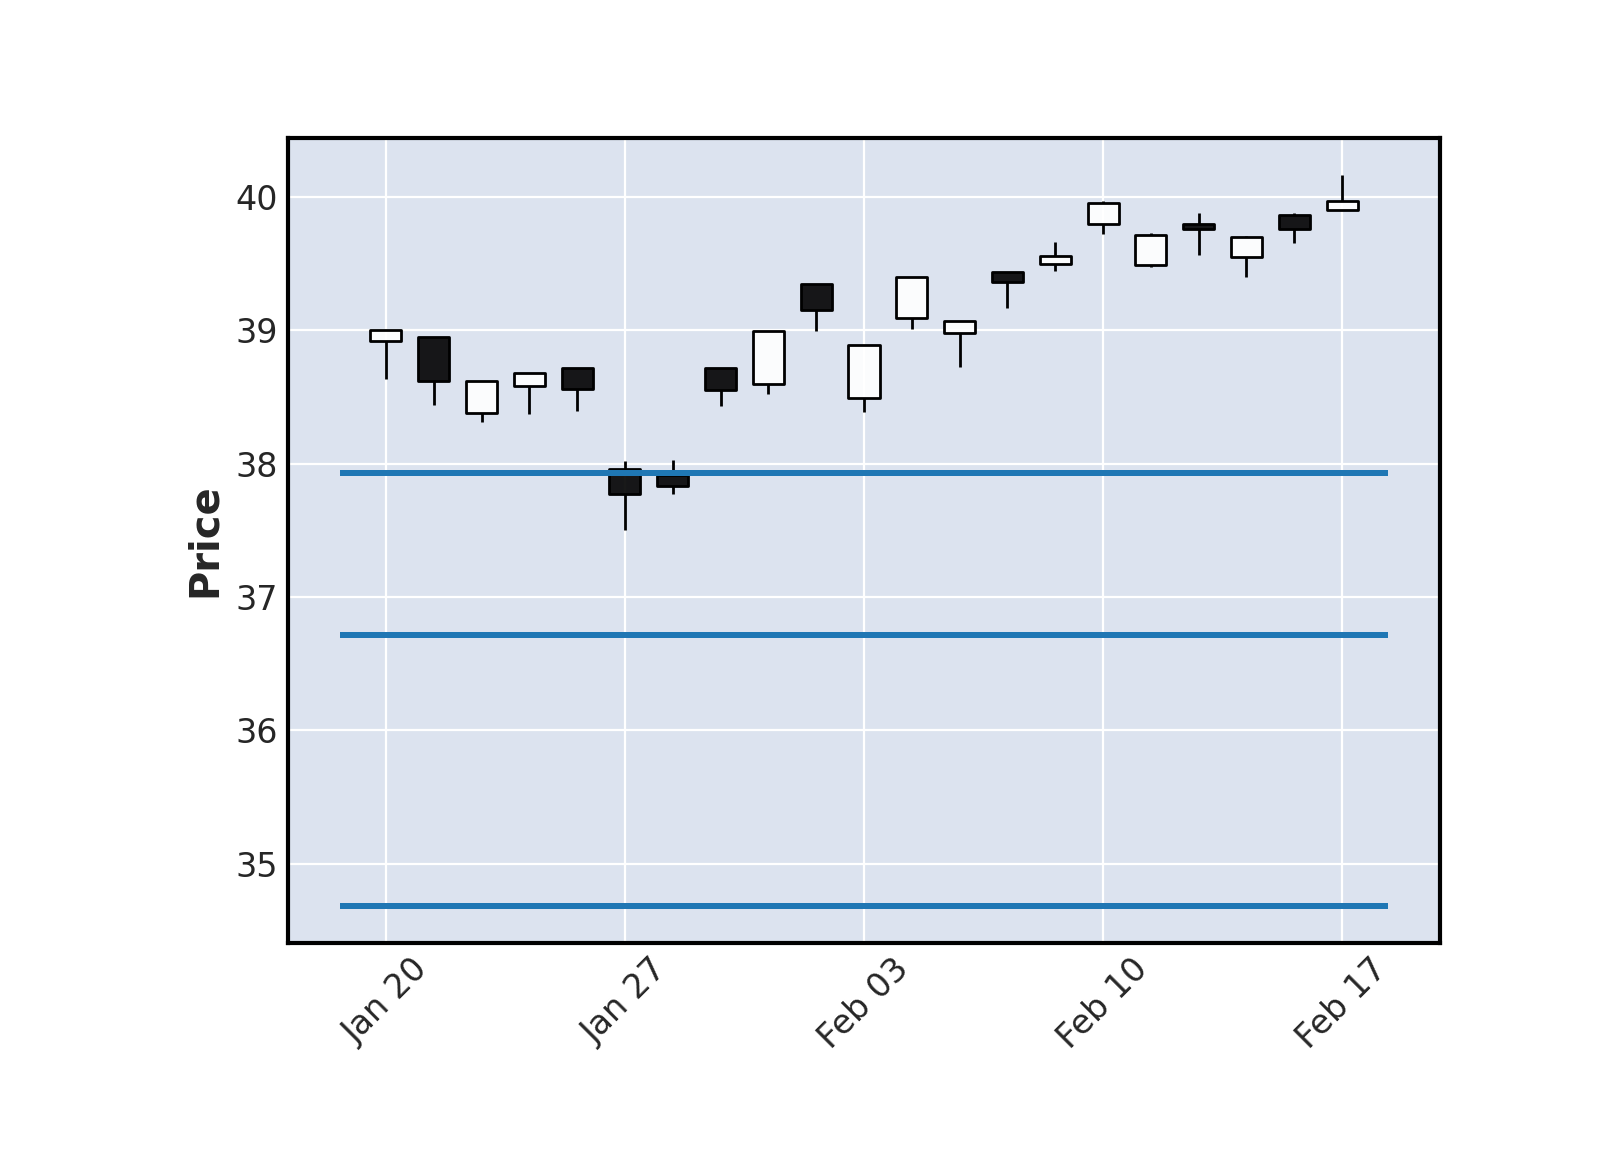
Graphique boursier
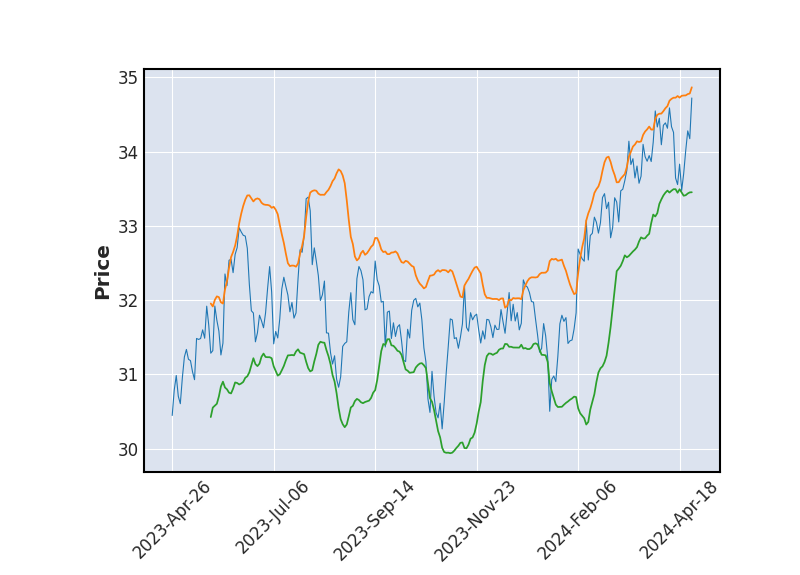 Bollinger
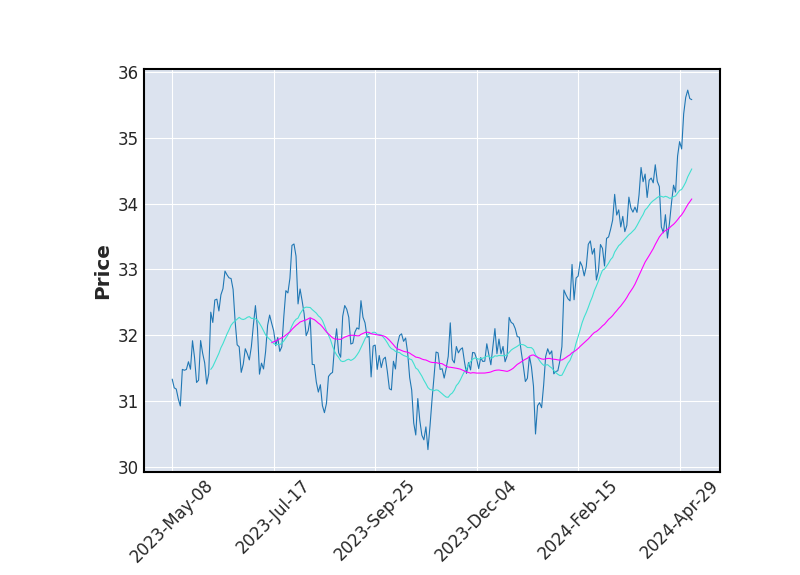 Moyenne Mobile
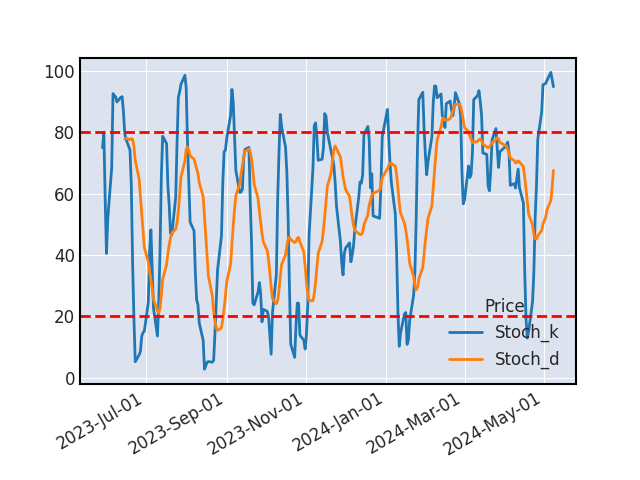 Stochastique
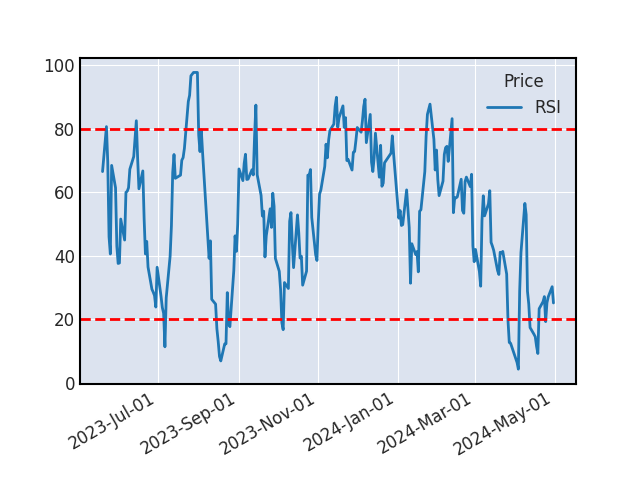 RSI
RSIAucun signal d'achat ou de vente sur le titre aujourd'hui.
VOLUME
Nous constatons plus de 50% d'échange de moins que d'habitude sur le titre.
SUPPORTS ET RESISTANCES
| Support Résistance | Rebond | Ecart avec le cours |
|---|---|---|
| 47.75 | 3 | -13.1% |
| 44.62 | 4 | -18.79% |
| 43.39 | 3 | -21.04% |
Historique de cours - AMUNDI MSCI EM ASIA UCITS ETF-C EUR
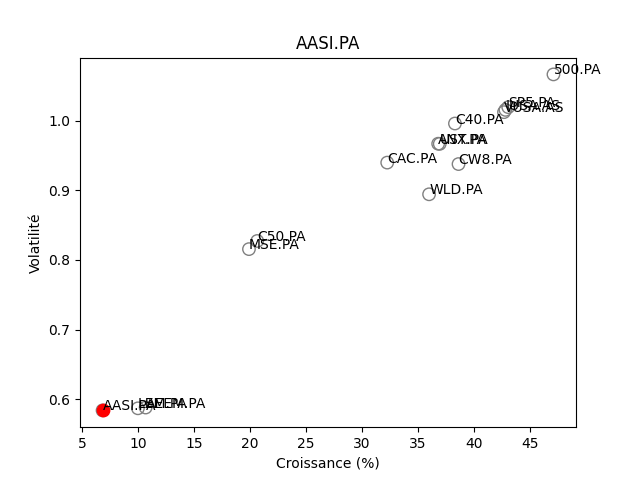
Positionnement boursier de AMUNDI MSCI EM ASIA UCITS ETF-C EUR

Version Beta