| Action | MMA | MACD_MME | Bollinger | Stochastique | RSI | Chandelier |
|---|---|---|---|---|---|---|
| AMUNDI EURO STOXX 50 UCITS ETF-C EUR | RAS | RAS | RAS | Neutre | Signal ↑ : 0.87% | Neutre | RAS |
AMUNDI EURO STOXX 50 UCITS ETF-C EUR : 168.66
| 1j | 5j | 1m | 3m | 1a |
|---|---|---|---|---|
| 0.13% | 1.26% | 1.15% | 9.55% | 19.67% |
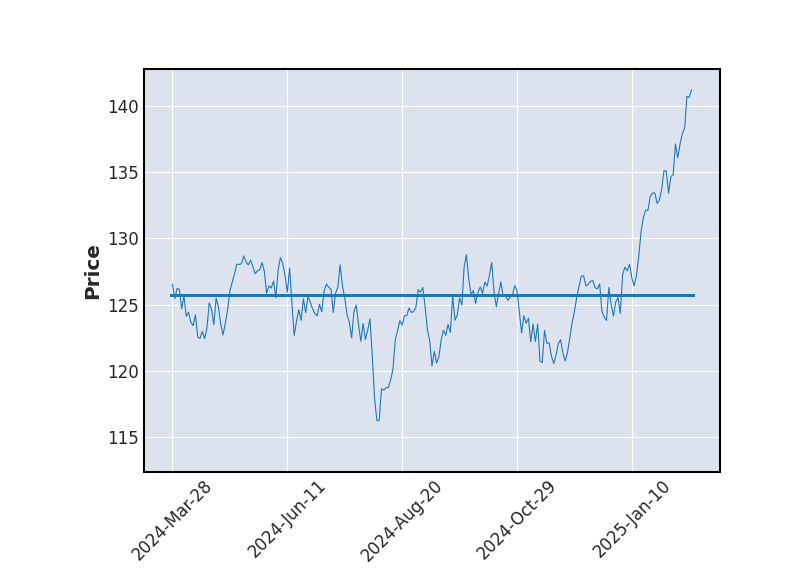
Evolution annuelle
Min : 134.68Moy : 153.22Max : 172.54
|
168.66
| Court terme | Moyen terme | Long terme |
|---|---|---|
 |  | |


Analyse Boursicot du 27/07/2026
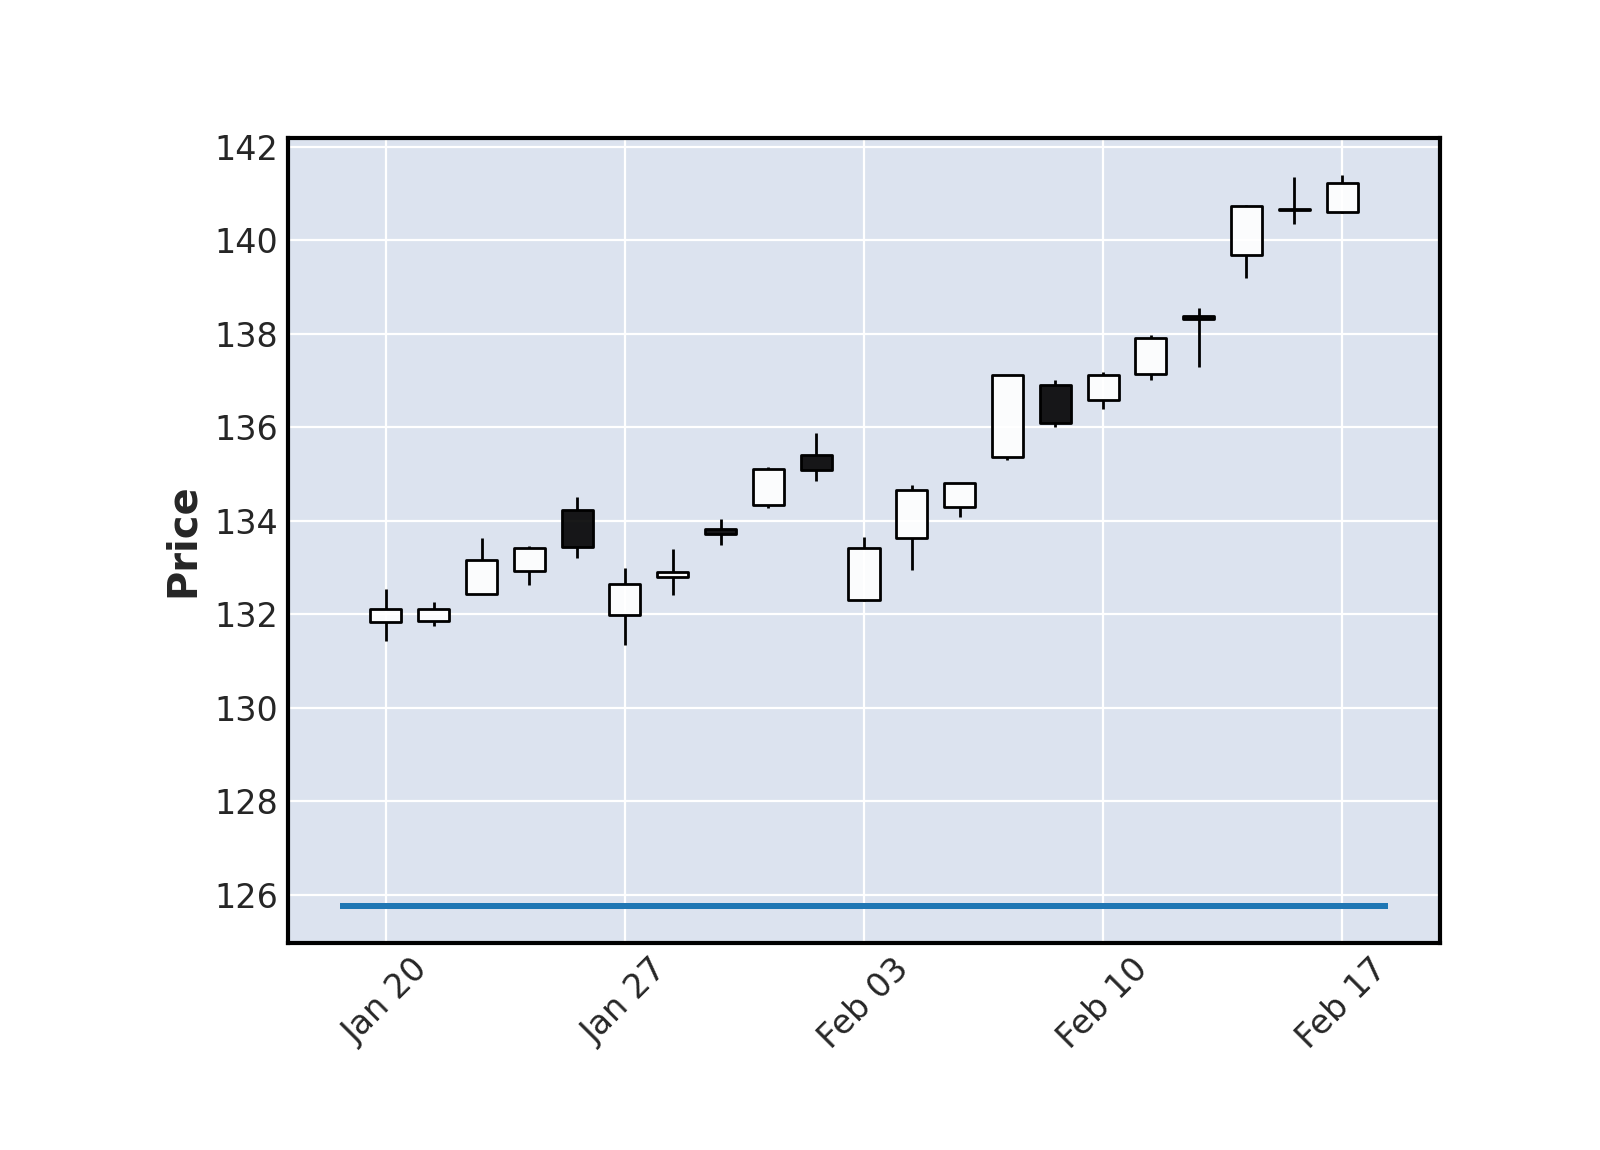
Graphique boursier
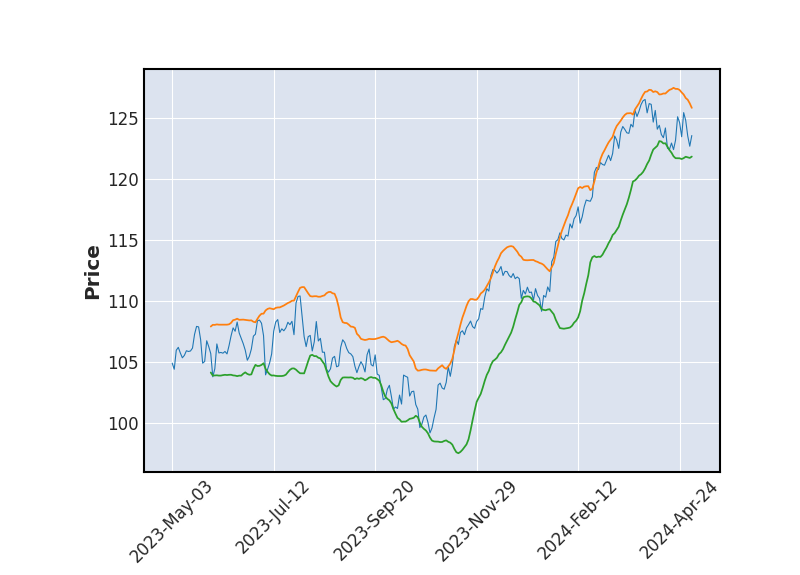 Bollinger
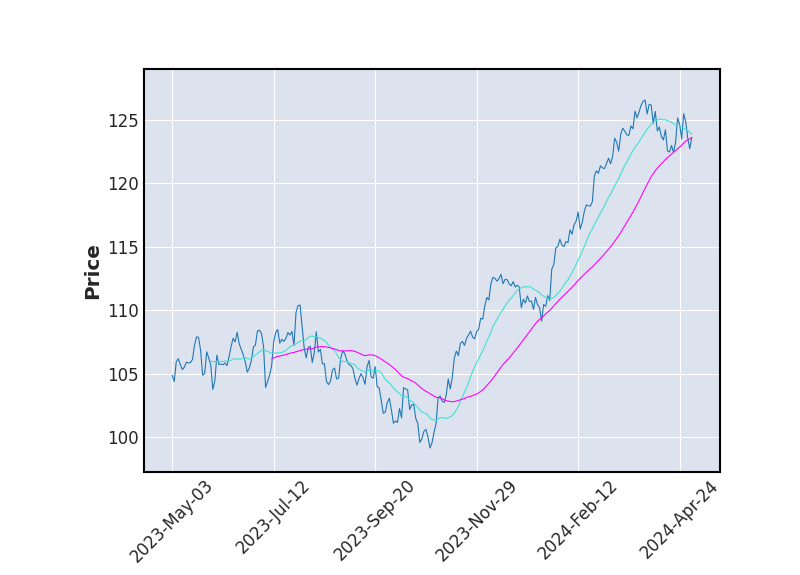 Moyenne Mobile
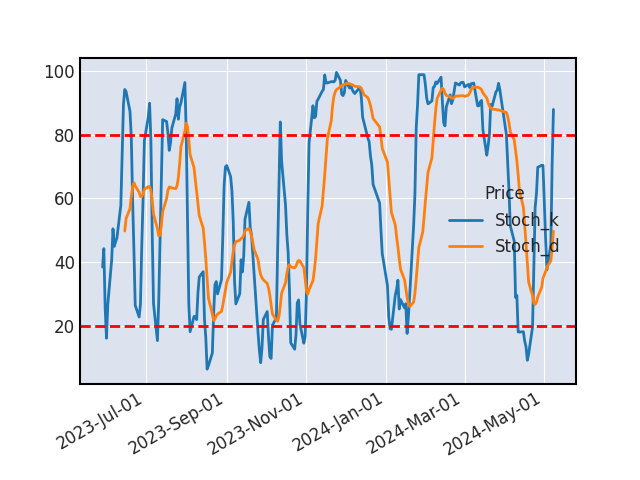 Stochastique
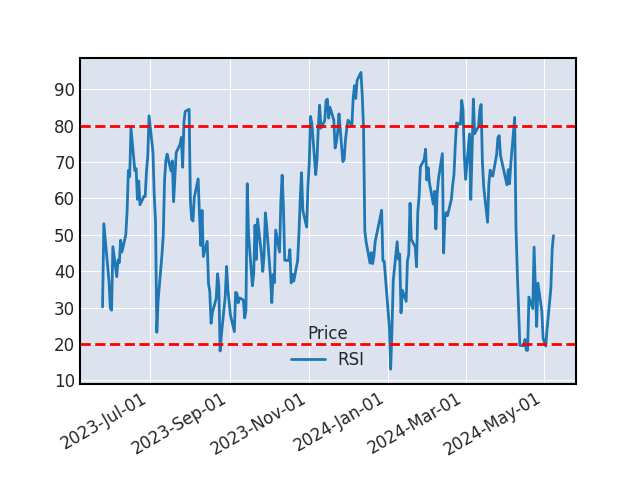 RSI
RSISTOCHASTIQUE
Le stochastique et son signal viennent de se croiser, indiquant une hausse à venir sur le titre (il est recommandé de valider ce signal haussier par un indicateur complémentaire).
SUPPORTS ET RESISTANCES
| Support Résistance | Rebond | Ecart avec le cours |
|---|---|---|
| 160.55 | 10 | -4.81% |
| 154.78 | 3 | -8.23% |
| 148.99 | 4 | -11.66% |
| 144.51 | 5 | -14.32% |
Historique de cours - AMUNDI EURO STOXX 50 UCITS ETF-C EUR
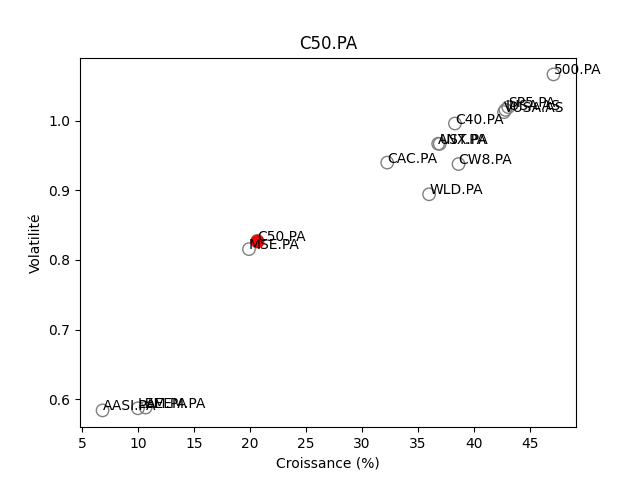
Positionnement boursier de AMUNDI EURO STOXX 50 UCITS ETF-C EUR

Version Beta