| Action | MMA | MACD_MME | Bollinger | Stochastique | RSI | Chandelier |
|---|---|---|---|---|---|---|
| VIVENDI | RAS | RAS | ↓ (Rétr.) | Neutre | RAS | Sur-achat↓ | RAS |
VIVENDI : 2.4
| 1j | 5j | 1m | 3m | 1a |
|---|---|---|---|---|
| -1.23% | 0% | 0% | 0% | -27.93% |
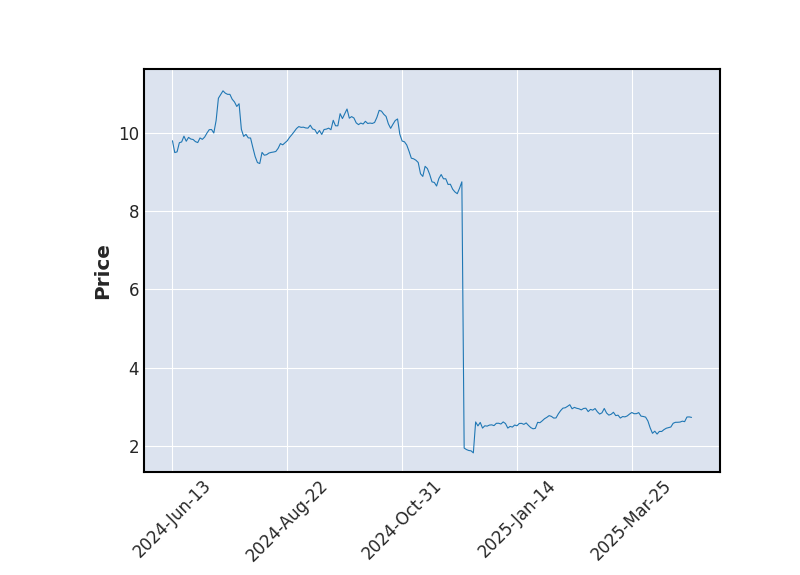
Evolution annuelle
Min : 2.3Moy : 2.91Max : 3.58
|
2.4
| Court terme | Moyen terme | Long terme |
|---|---|---|
 |  | |


Analyse Boursicot du 06/01/2026
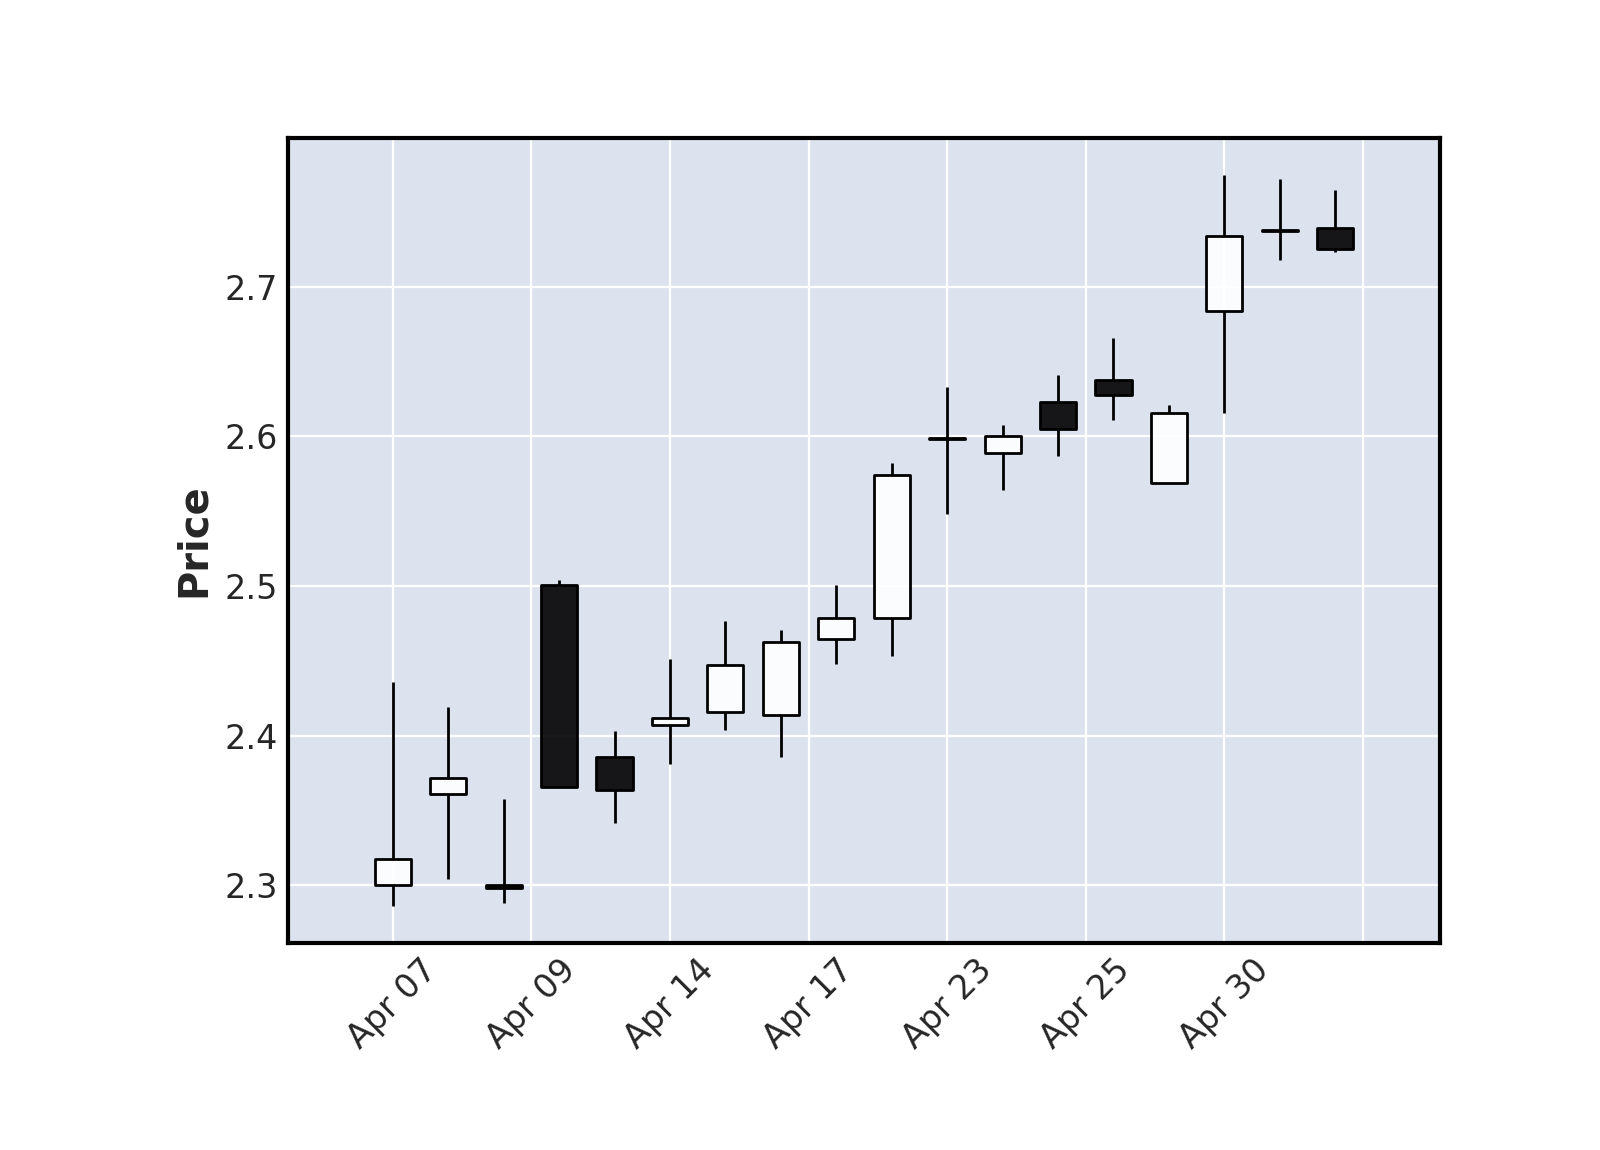
Graphique boursier
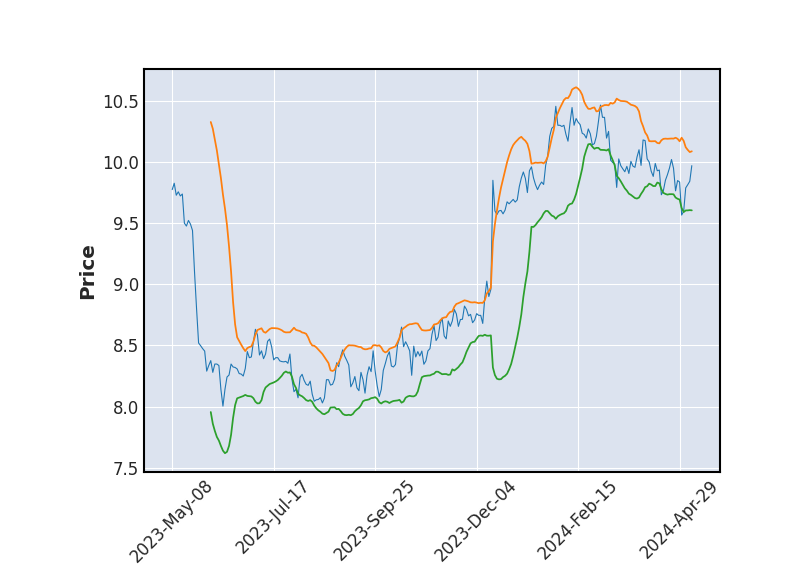 Bollinger
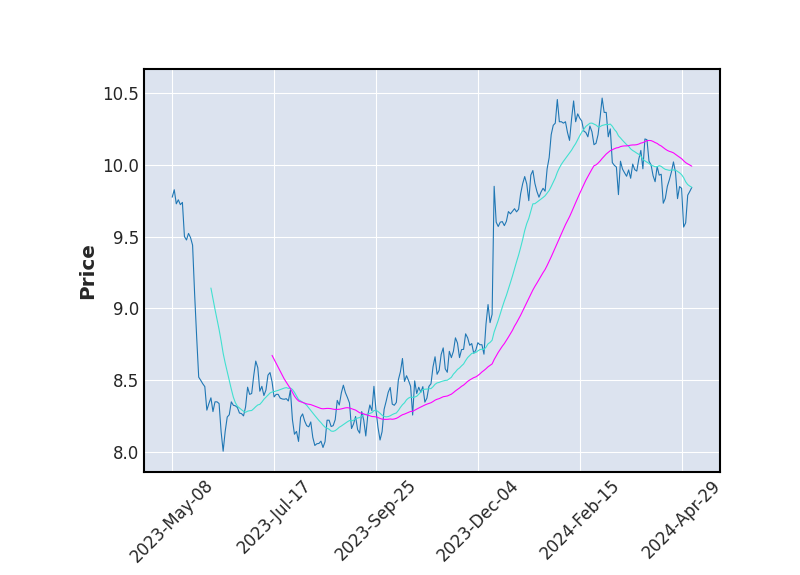 Moyenne Mobile
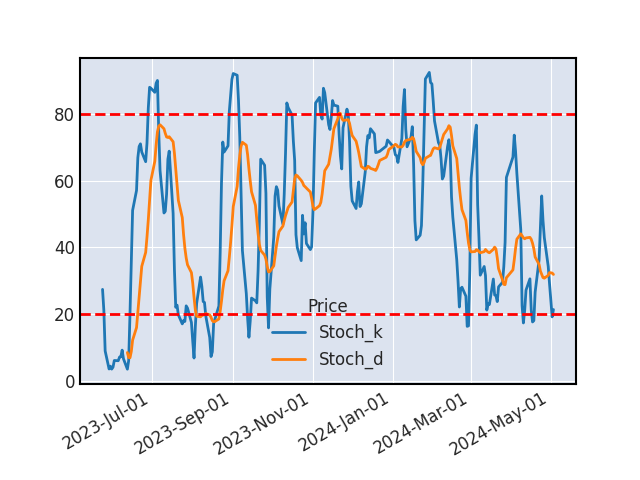 Stochastique
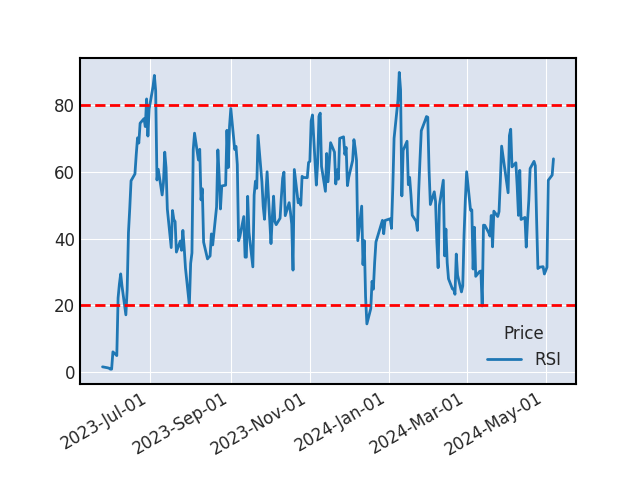 RSI
RSIBOLLINGER
On constate un signal baissier du cours de VIVENDI suite au retour du cours à l’intérieur des bandes de Bollinger.
RSI
L’action VIVENDI était sur-achetée, le RSI vient de revenir sous les 80. Une baisse du cours est à prévoir.
VOLUME
Les échanges sont peu nombreux aujourd'hui, le mouvement est faible.
SUPPORTS ET RESISTANCES
| Support Résistance | Rebond | Ecart avec le cours |
|---|---|---|
| 2.94 | 7 | 22.31% |
| 2.85 | 4 | 18.41% |
Historique de cours - VIVENDI
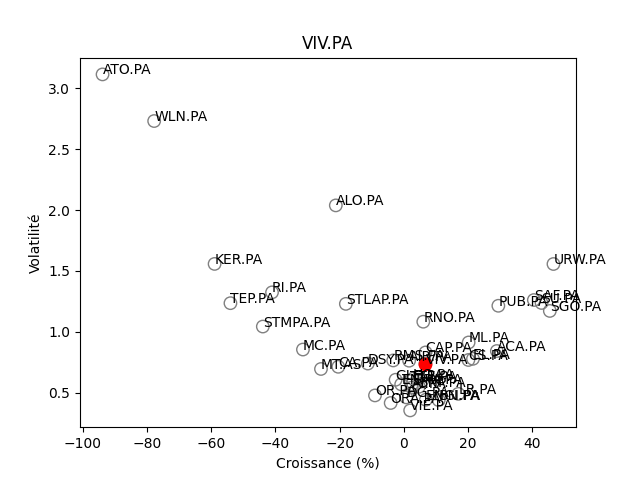
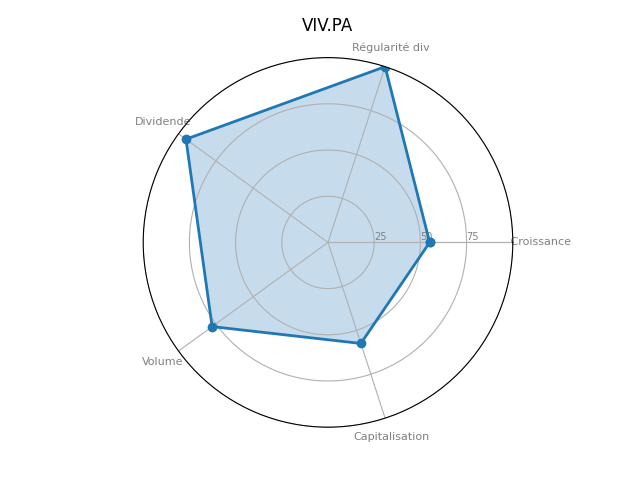
Positionnement boursier de VIVENDI
Version Beta