| Action | MMA | MACD_MME | Bollinger | Stochastique | RSI | Chandelier |
|---|---|---|---|---|---|---|
| FRESENIUS MEDIC | RAS | RAS | RAS | Neutre | Signal ↓ : -4.21% | Neutre | RAS |
FRESENIUS MEDIC : 40.84
| 1j | 5j | 1m | 3m | 1a |
|---|---|---|---|---|
| -0.39% | 0% | 0% | 0% | -13.51% |
Evolution annuelle
Min : 39.6Moy : 44.14Max : 48.14
|
40.84
| Court terme | Moyen terme | Long terme |
|---|---|---|
 | |  |


Analyse Boursicot du 29/09/2023
Graphique boursier
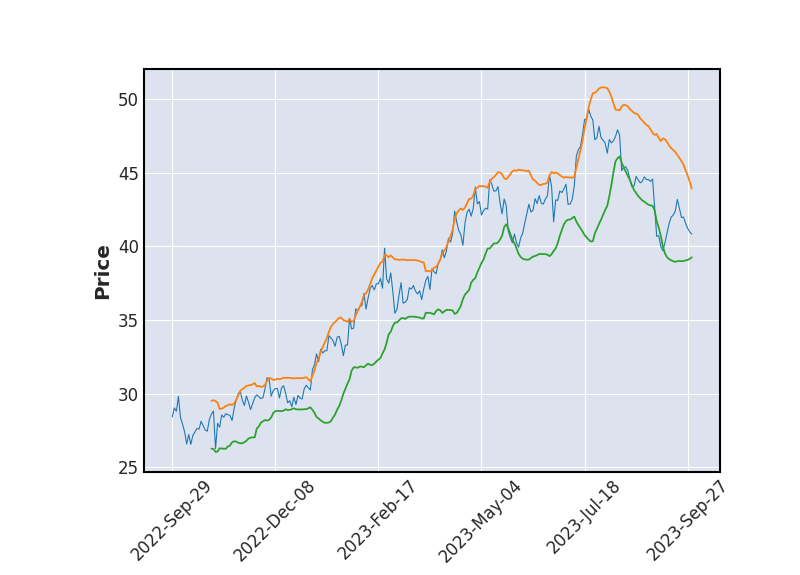 Bollinger
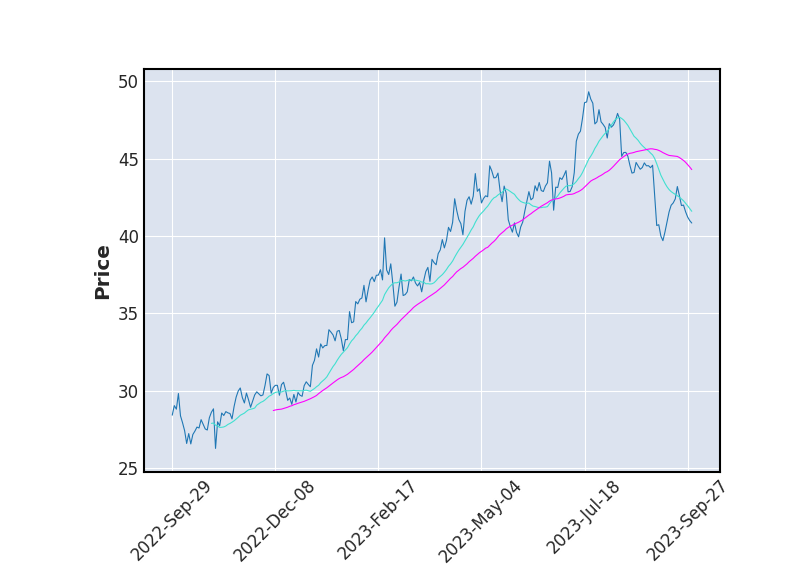 Moyenne Mobile
 Stochastique
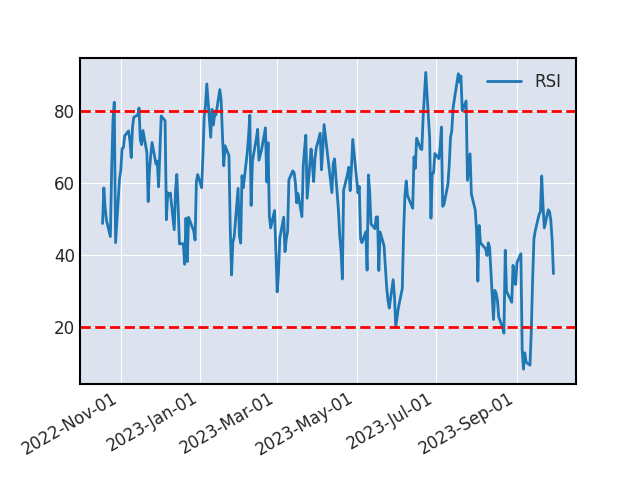 RSI
RSISTOCHASTIQUE
Le stochastique et son signal viennent de se croiser, indiquant une baisse à venir sur le titre (il est recommandé de valider ce signal baissier par un indicateur complémentaire).
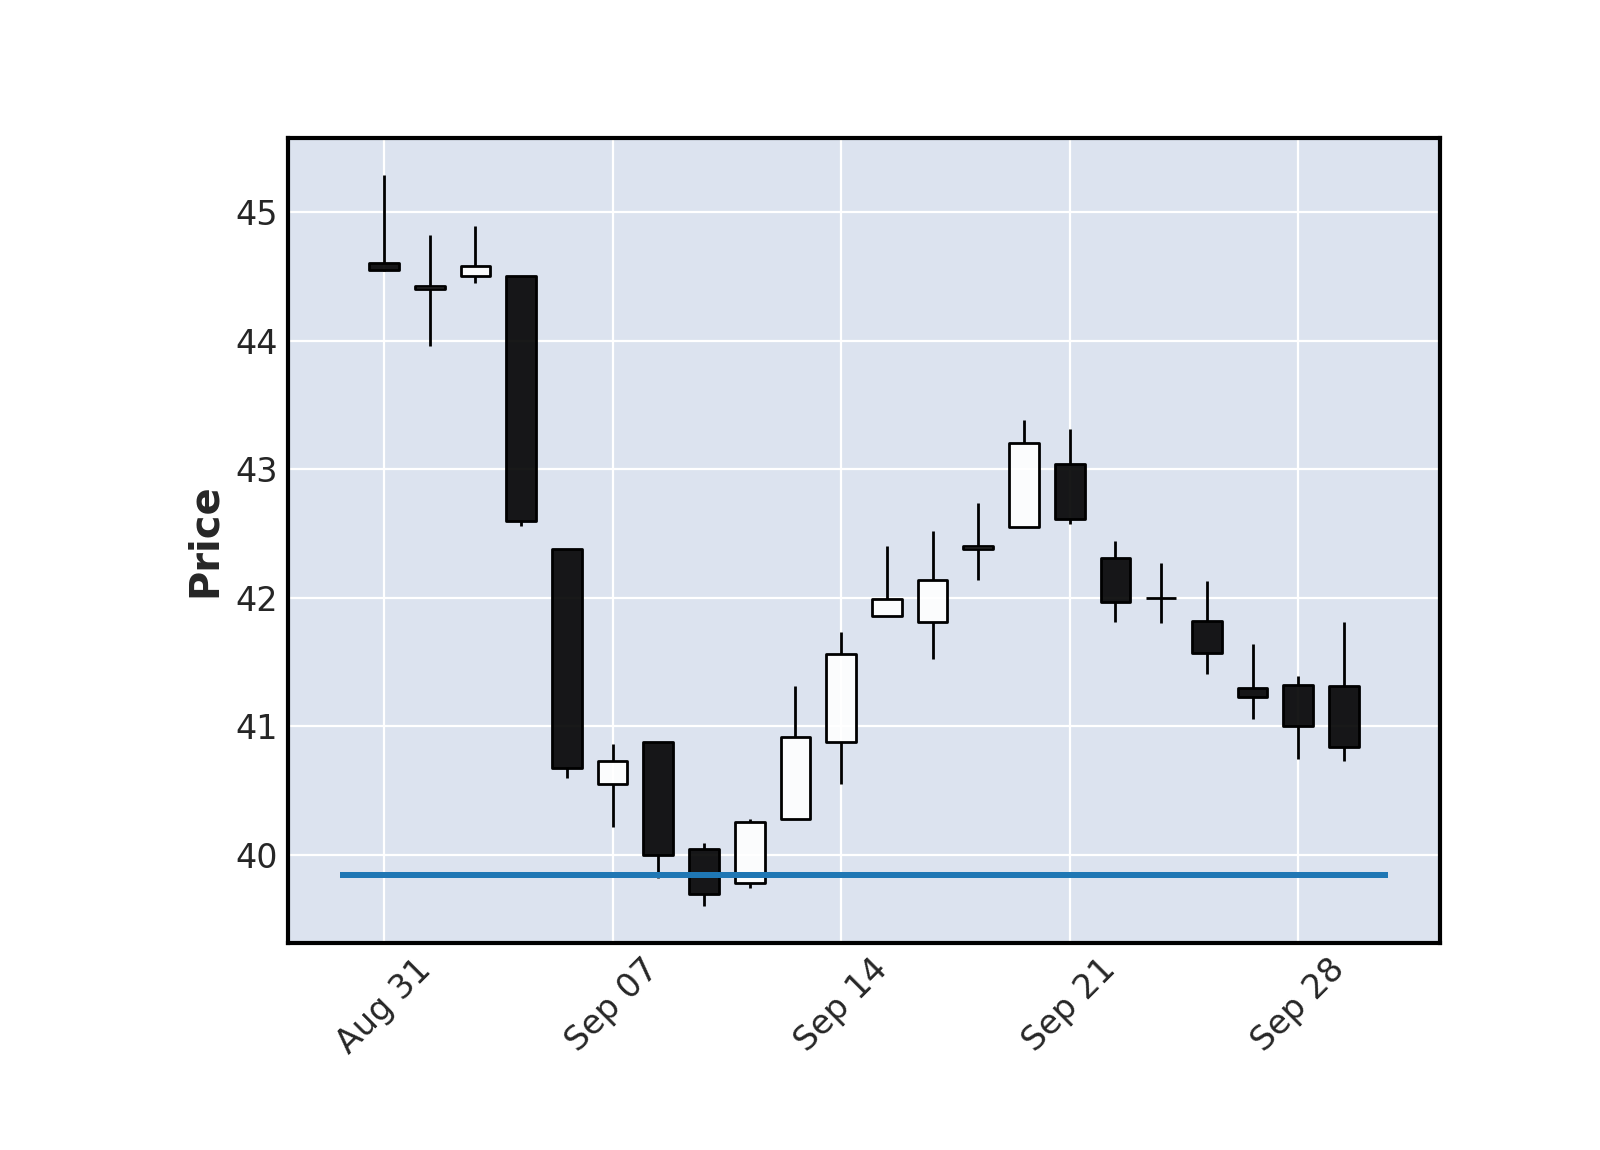
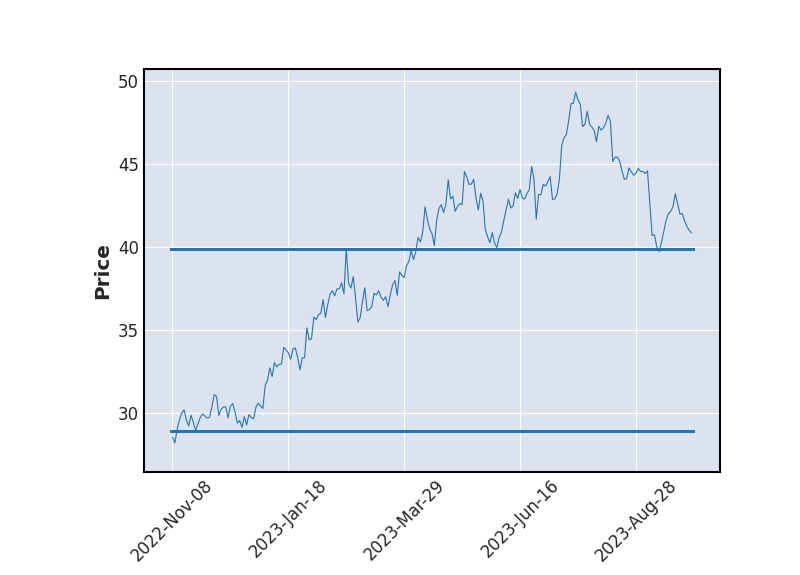
SUPPORTS ET RESISTANCES
| Support Résistance | Rebond | Ecart avec le cours |
|---|---|---|
| 39.84 | 4 | -2.44% |
| 28.87 | 3 | -29.31% |
Historique de cours - FRESENIUS MEDIC
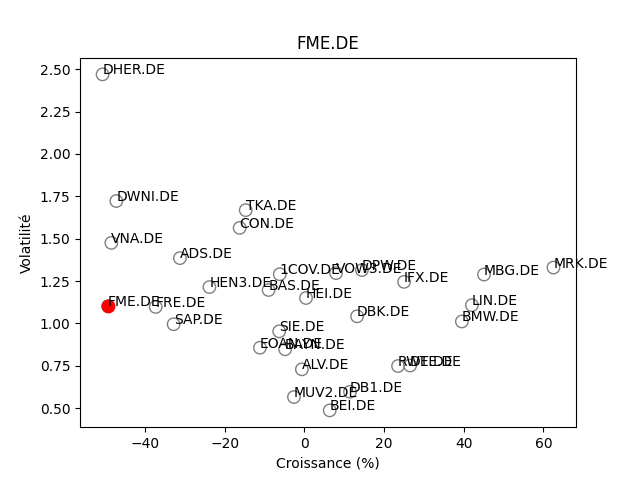
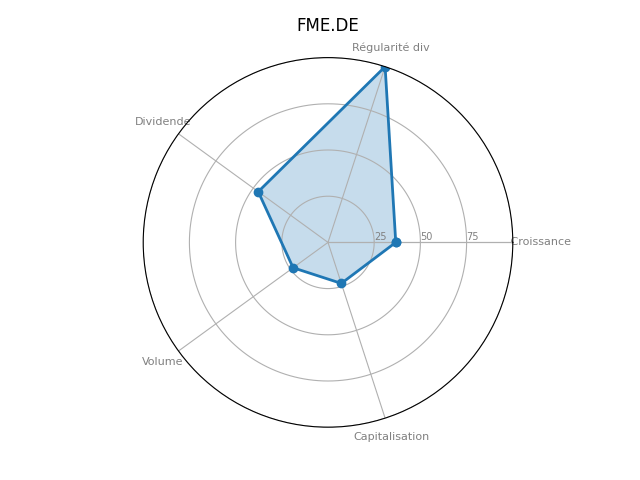
Positionnement boursier de FRESENIUS MEDIC
Version Beta