| Action | MMA | MACD_MME | Bollinger | Stochastique | RSI | Chandelier |
|---|---|---|---|---|---|---|
| INFINEON TECHNOLO | RAS | RAS | RAS | Neutre | RAS | Neutre | RAS |
INFINEON TECHNOLO : 41.92
| 1j | 5j | 1m | 3m | 1a |
|---|---|---|---|---|
| 5.04% | 0% | 0% | 0% | 24.02% |
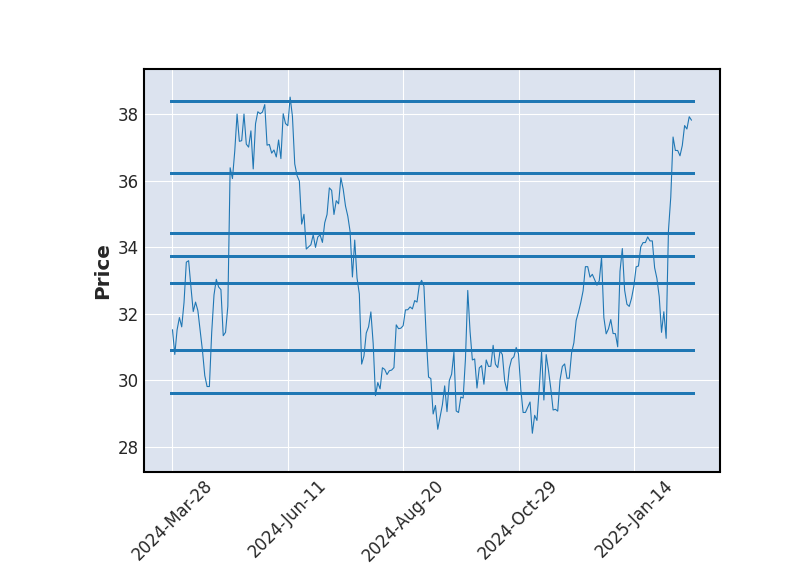
Evolution annuelle
Min : 30.82Moy : 34.68Max : 42.03
|
41.92
| Court terme | Moyen terme | Long terme |
|---|---|---|
 | | |


Analyse Boursicot du 06/01/2026
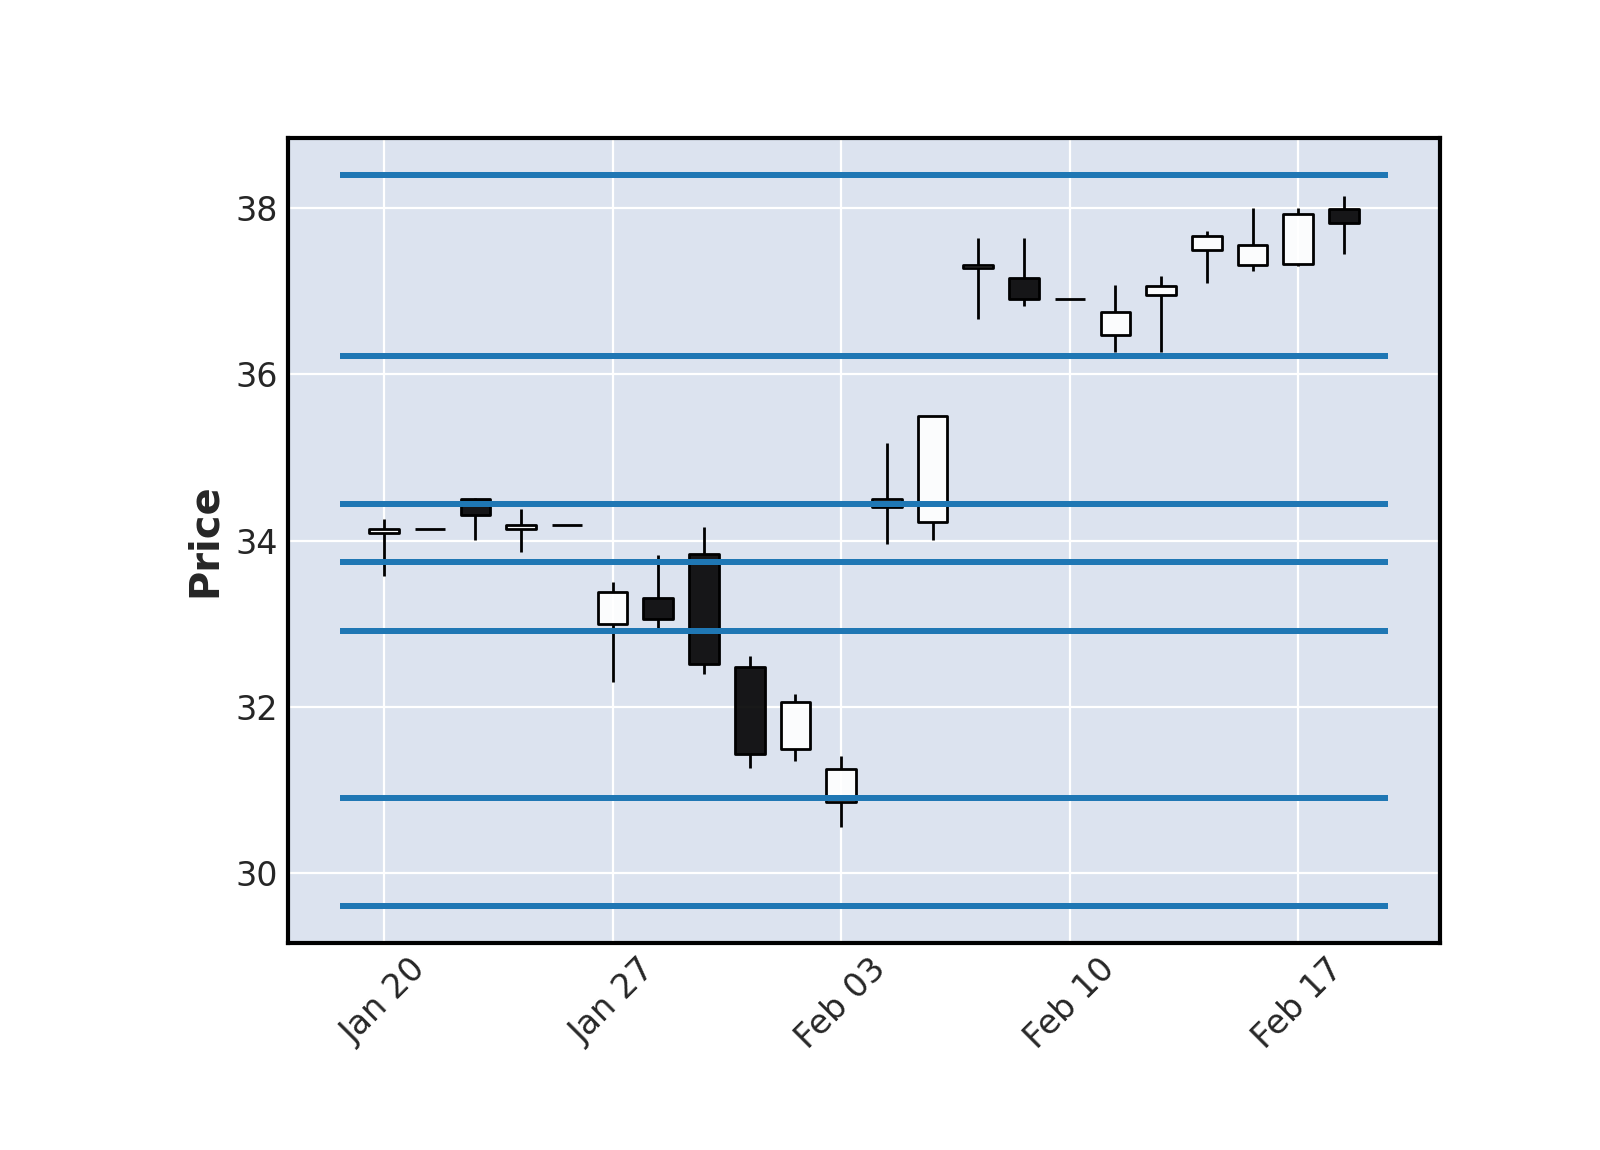
Graphique boursier
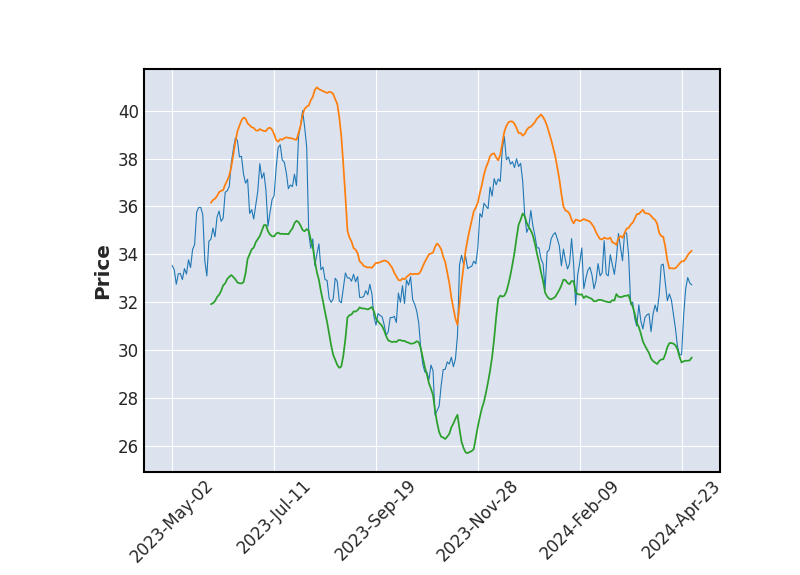 Bollinger
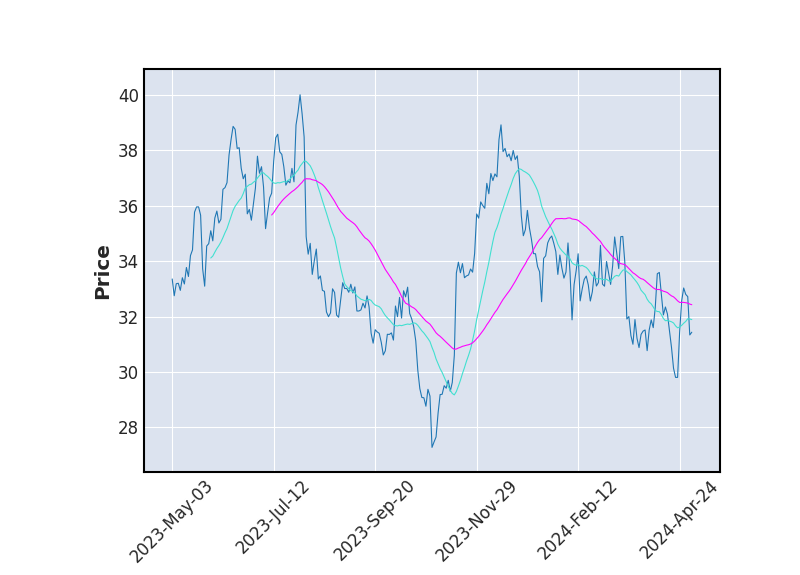 Moyenne Mobile
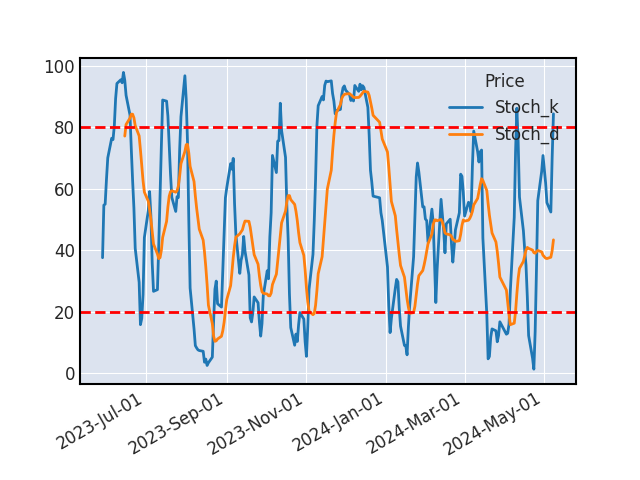 Stochastique
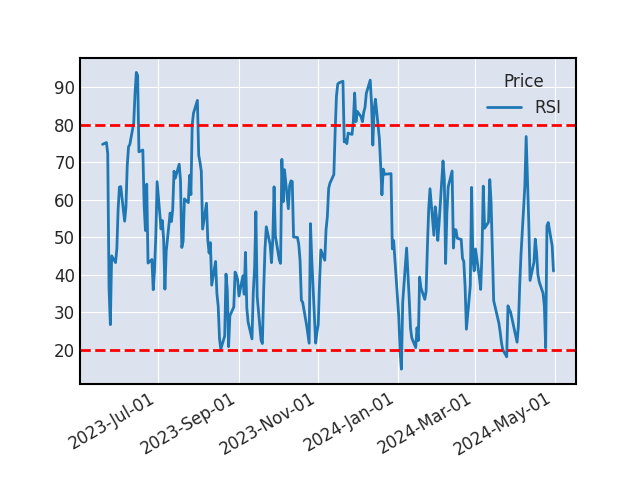 RSI
RSILe titre ne donne aucun signal d'achat ou de vente.
VOLUME
Les volumes échangés sur le titre INFINEON TECHNOLO sont particulièrement fort aujourdhui (plus de 50% au-dessus de la moyenne).
SUPPORTS ET RESISTANCES
| Support Résistance | Rebond | Ecart avec le cours |
|---|---|---|
| 36.91 | 3 | -11.94% |
| 34.11 | 11 | -18.62% |
Historique de cours - INFINEON TECHNOLO
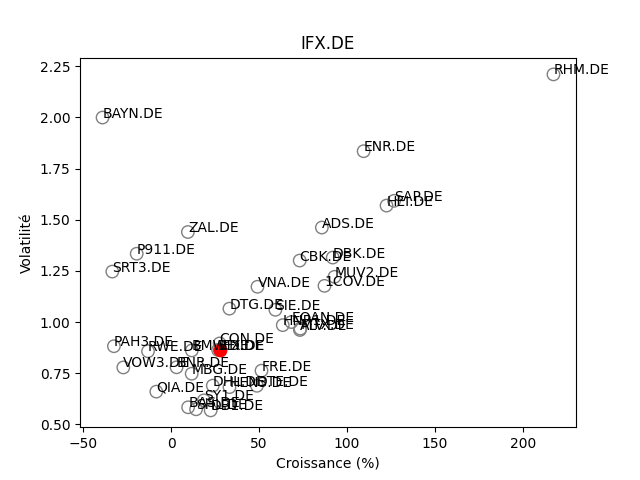
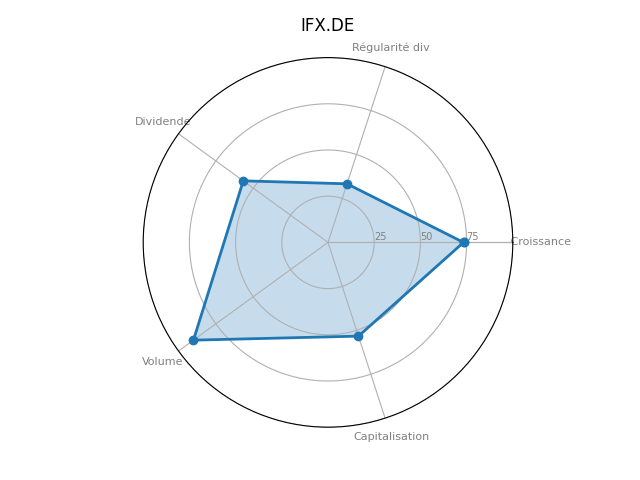
Positionnement boursier de INFINEON TECHNOLO
Version Beta