| Action | MMA | MACD_MME | Bollinger | Stochastique | RSI | Chandelier |
|---|---|---|---|---|---|---|
| THYSSENKRUPP | RAS | RAS | RAS | Neutre | Signal ↑ : 26.33% | Neutre | RAS |
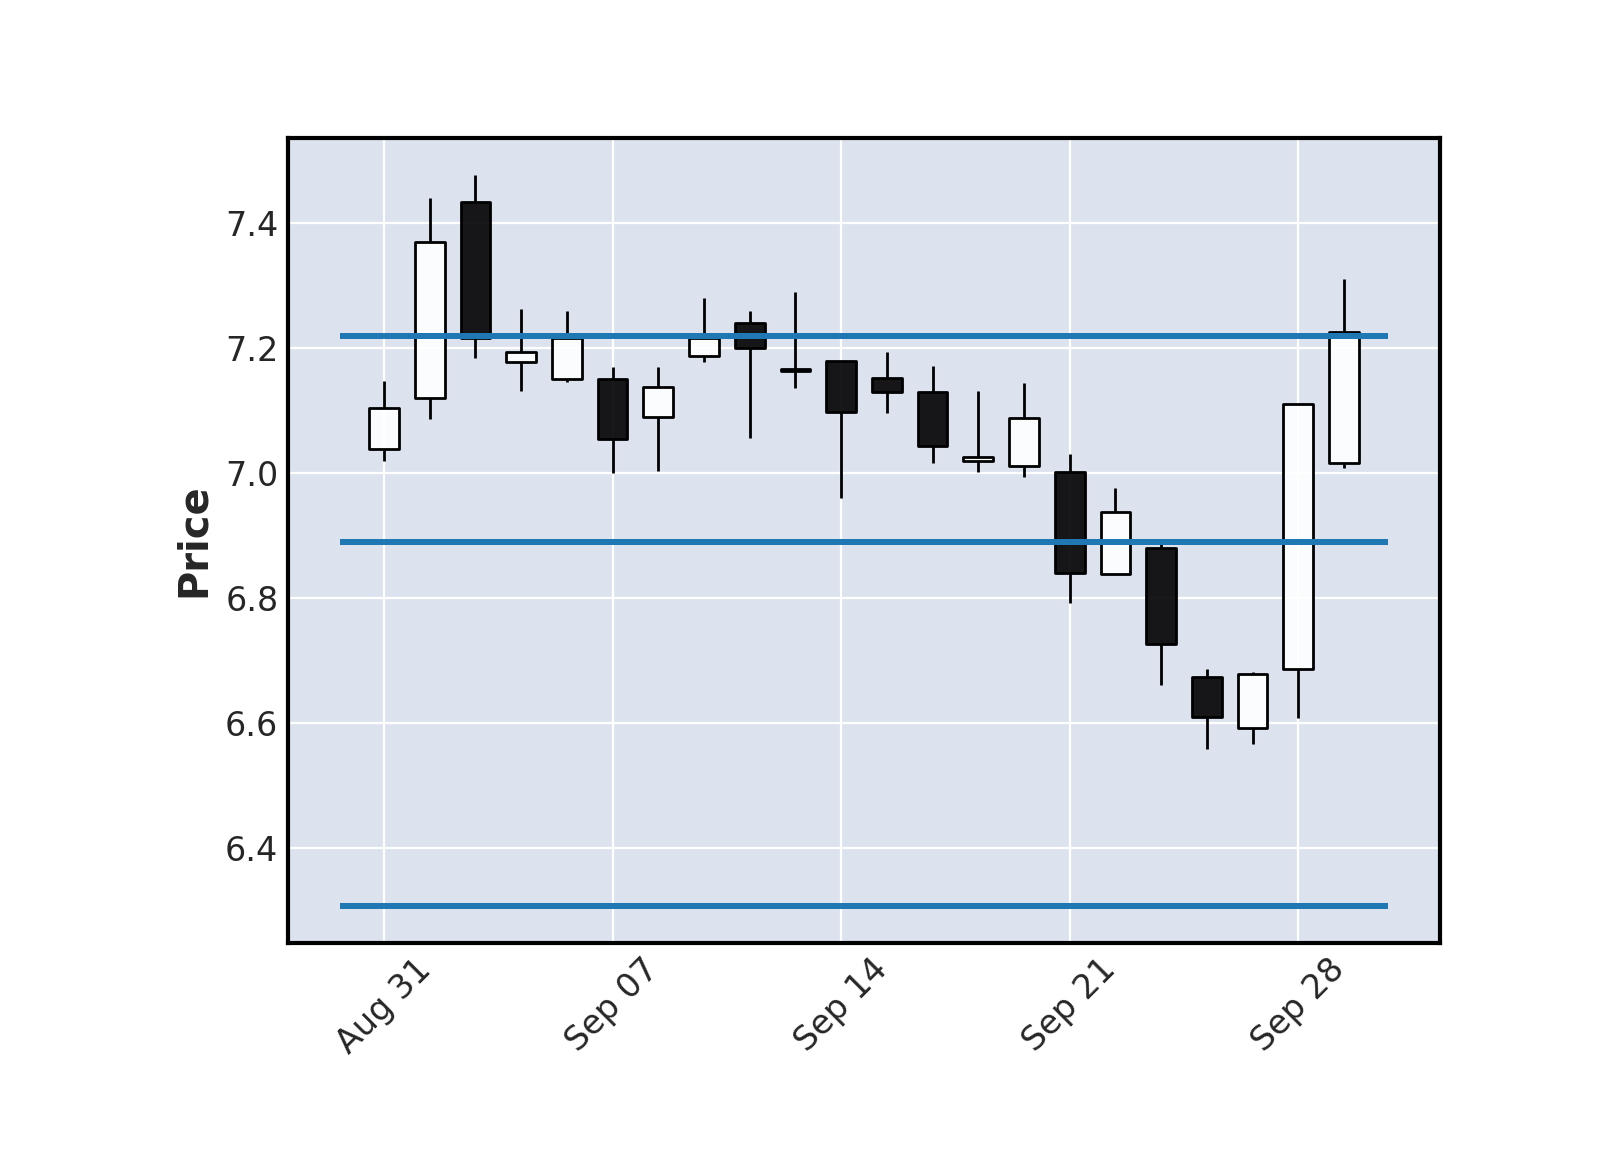
THYSSENKRUPP : 7.23
| 1j | 5j | 1m | 3m | 1a |
|---|---|---|---|---|
| 1.69% | 0% | 0% | 0% | 0% |
Evolution annuelle
Min : 6.56Moy : 6.98Max : 7.44
|
7.23
| Court terme | Moyen terme | Long terme |
|---|---|---|
 | |  |


Analyse Boursicot du 29/09/2023
Graphique boursier
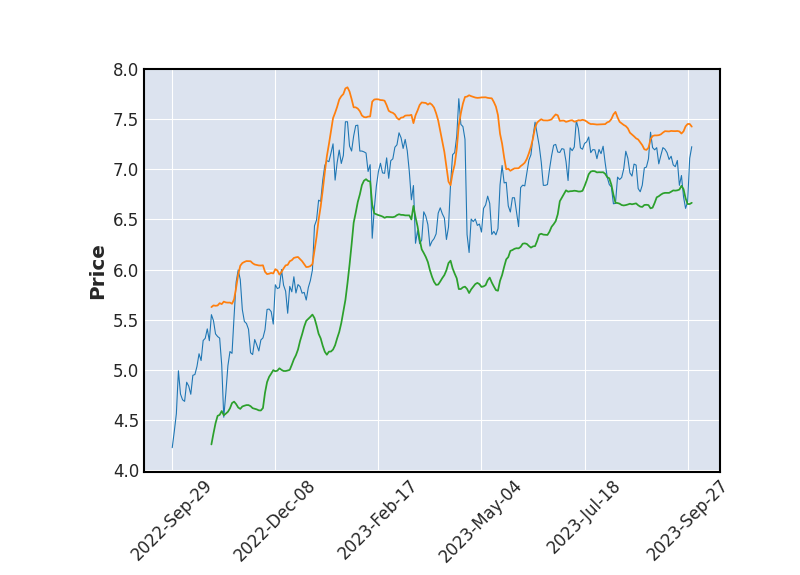 Bollinger
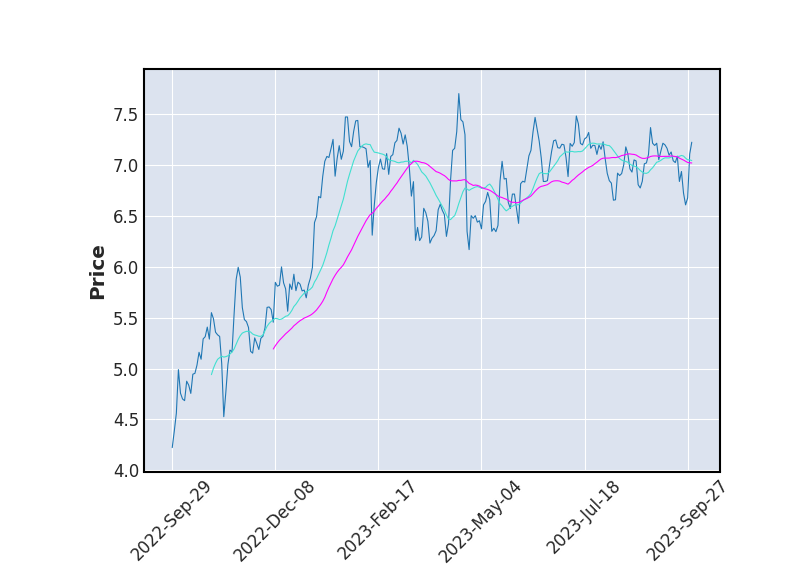 Moyenne Mobile
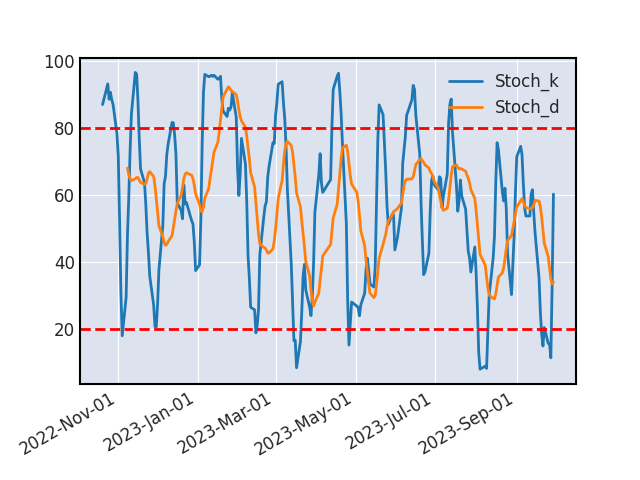 Stochastique
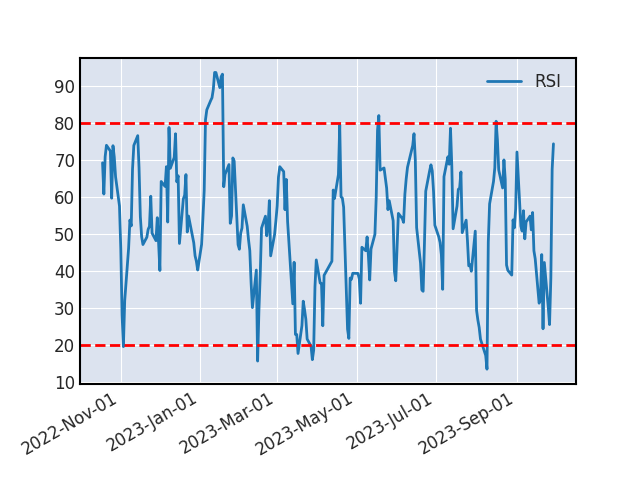 RSI
RSISTOCHASTIQUE
Le stochastique (%K) vient de croiser son signal (%D), une hausse devrait se produire sur le titre (à valider par un indicateur secondaire).
VOLUME
Les échanges sont très étoffés aujourd'hui, le mouvement est fort.
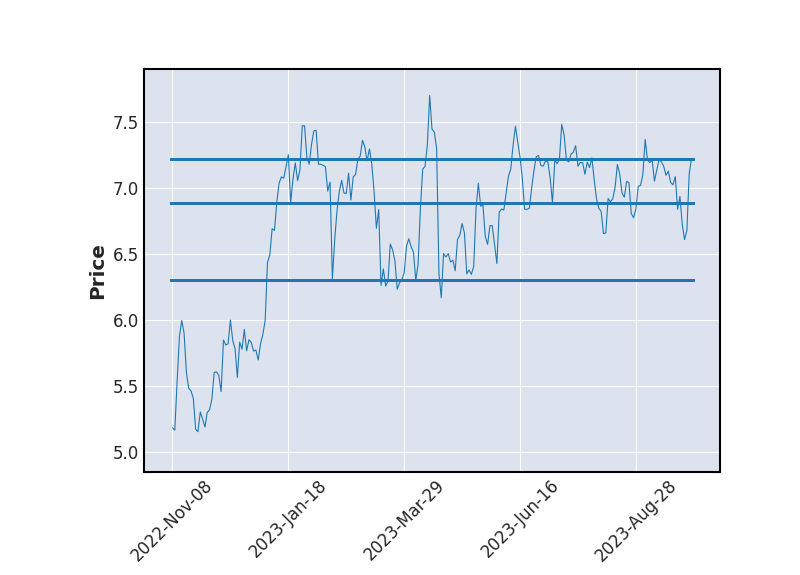
SUPPORTS ET RESISTANCES
| Support Résistance | Rebond | Ecart avec le cours |
|---|---|---|
| 7.22 | 4 | -0.09% |
| 6.89 | 3 | -4.65% |
| 6.31 | 3 | -12.73% |
Historique de cours - THYSSENKRUPP
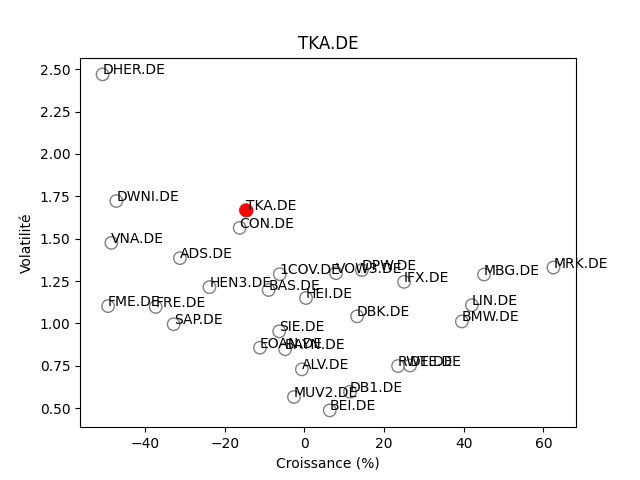
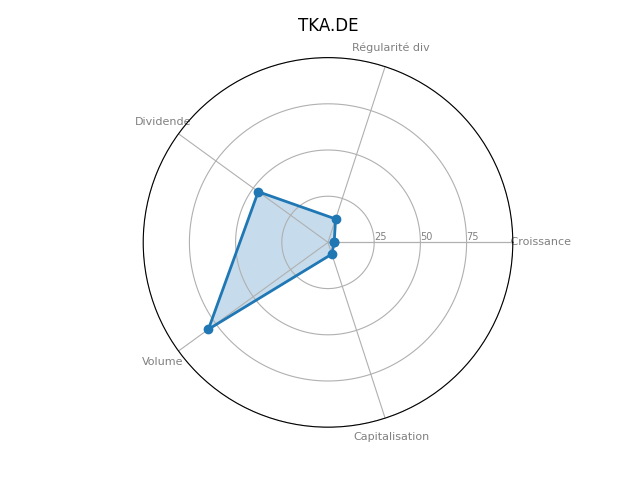
Positionnement boursier de THYSSENKRUPP
Version Beta