| Action | MMA | MACD_MME | Bollinger | Stochastique | RSI | Chandelier |
|---|---|---|---|---|---|---|
| ADIDAS | Signal ↑ : 0.0047% | RAS | RAS | Sur-achat↓ | Signal ↓ : -10.56% | Neutre | RAS |
ADIDAS : 163.7
| 1j | 5j | 1m | 3m | 1a |
|---|---|---|---|---|
| -3.65% | 0% | 0% | 0% | -17.2% |
Evolution annuelle
Min : 150.4Moy : 171.31Max : 199.7
|
163.7
| Court terme | Moyen terme | Long terme |
|---|---|---|
 |  | |


Analyse Boursicot du 06/01/2026
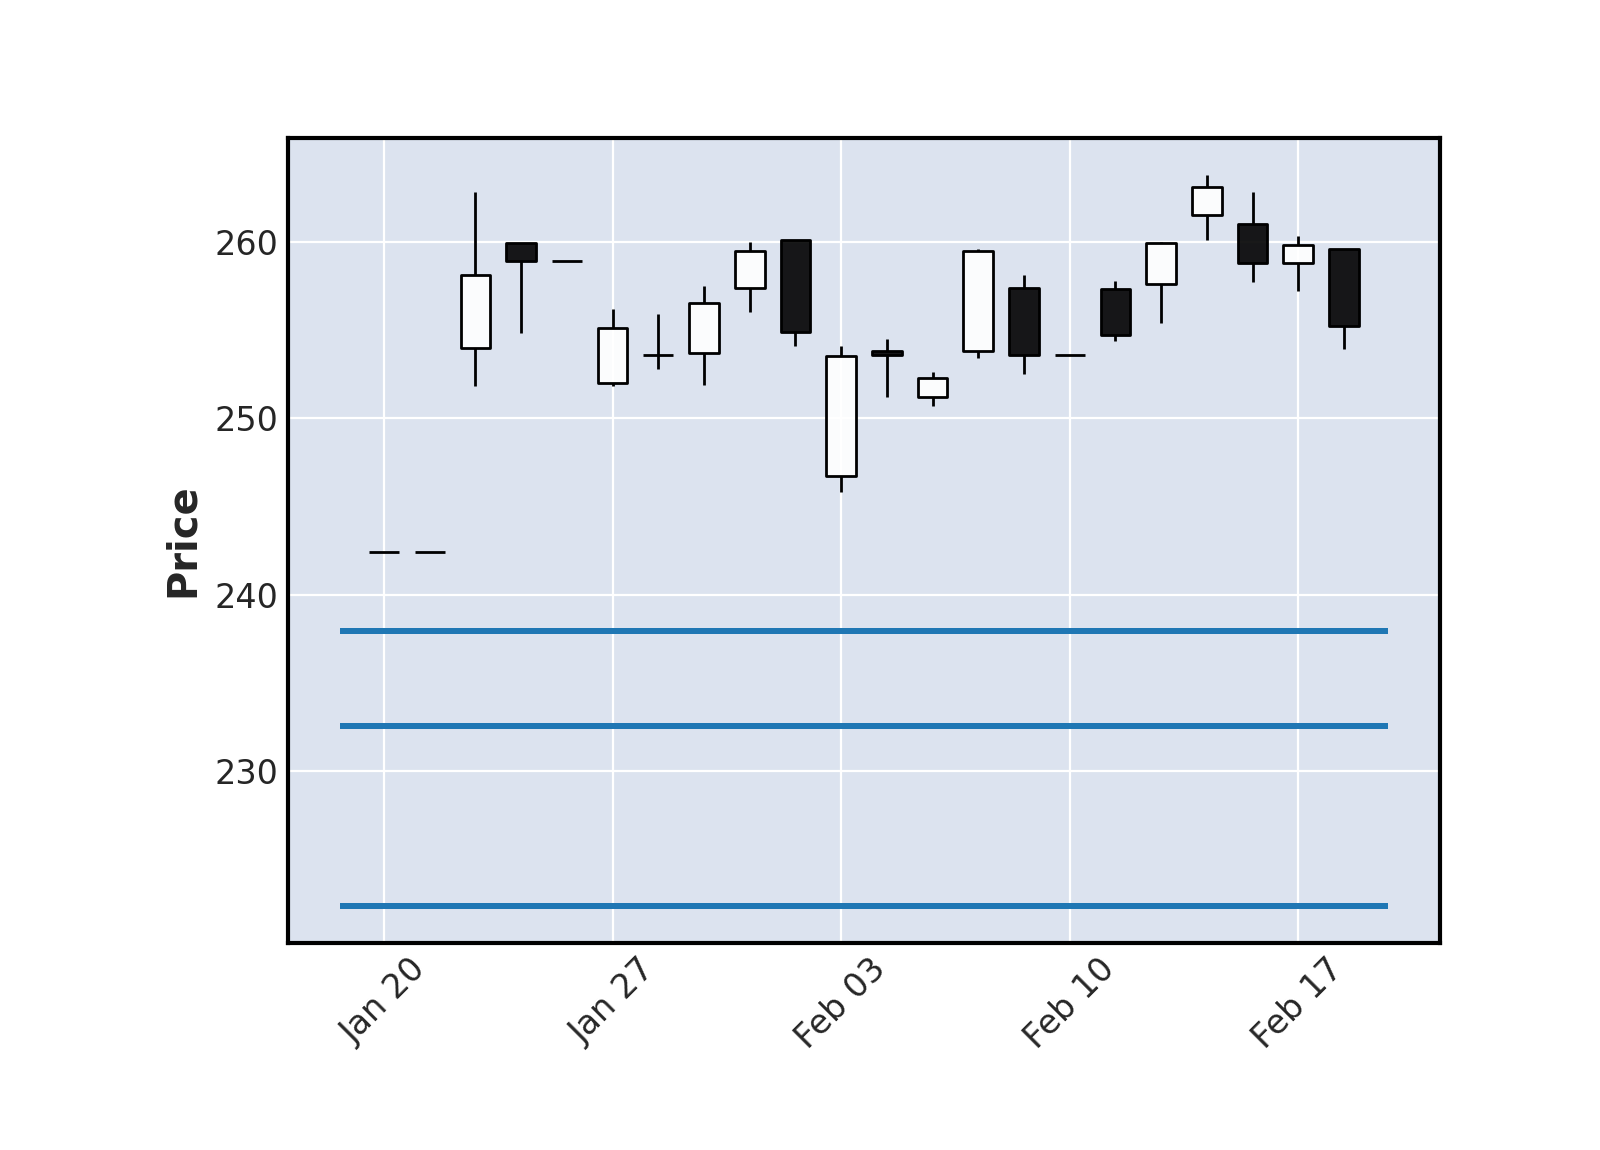
Graphique boursier
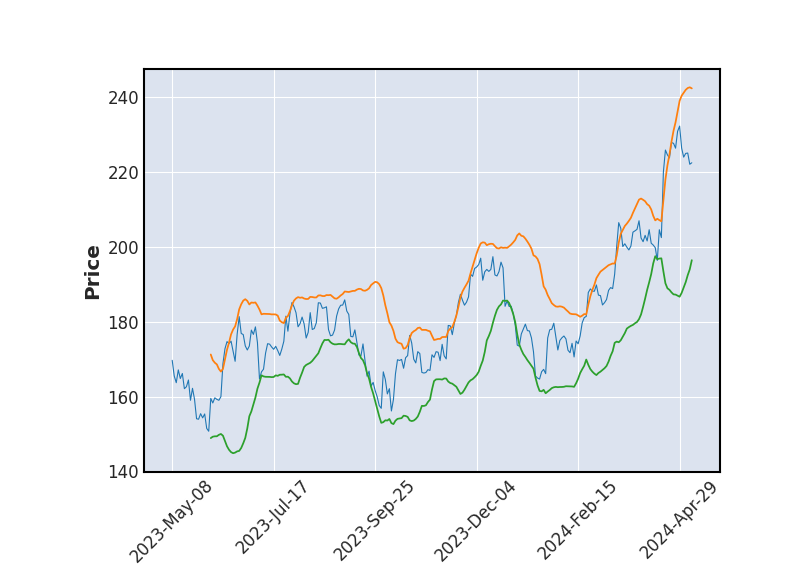 Bollinger
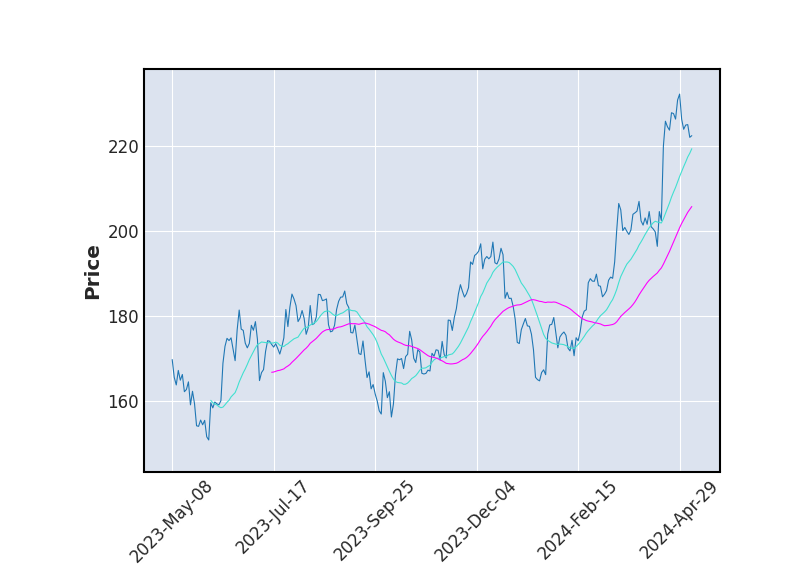 Moyenne Mobile
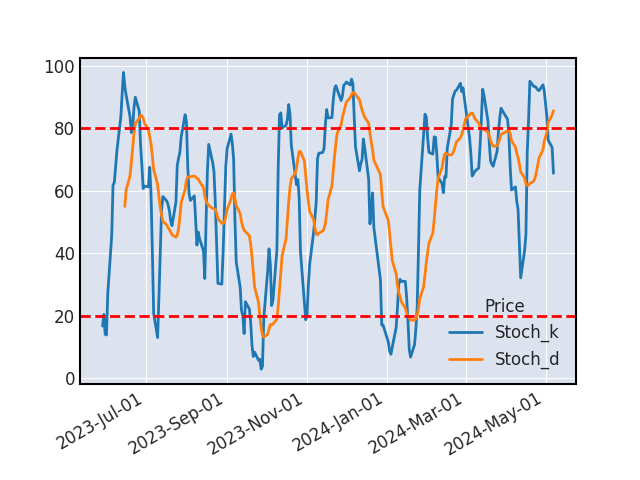 Stochastique
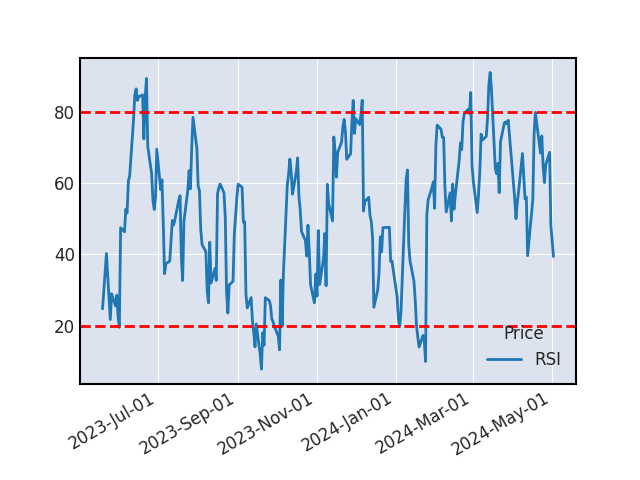 RSI
RSIMMA
La divergence des MMA20 et MMA50 semble indiquer une hausse à venir, ce signal doit être confirmé par d'autres indicateurs.
STOCHASTIQUE
L’action ADIDAS était sur-achetée, le stochastique vient de revenir sous les 80. Une baisse du cours est à prévoir. Une baisse devrait survenir sur le titre suite au croisement du stochastique %K et de son signal %D en cas de confirmation par un autre indicateur technique.
L'analyse des différents indicateurs ne permet pas de trancher, il conviendra d'attendre un signal clair.
VOLUME
Les échanges sont très étoffés aujourd'hui, le mouvement est fort.
SUPPORTS ET RESISTANCES
| Support Résistance | Rebond | Ecart avec le cours |
|---|---|---|
| Aucun support/résistance n'a pu être identifié | ||
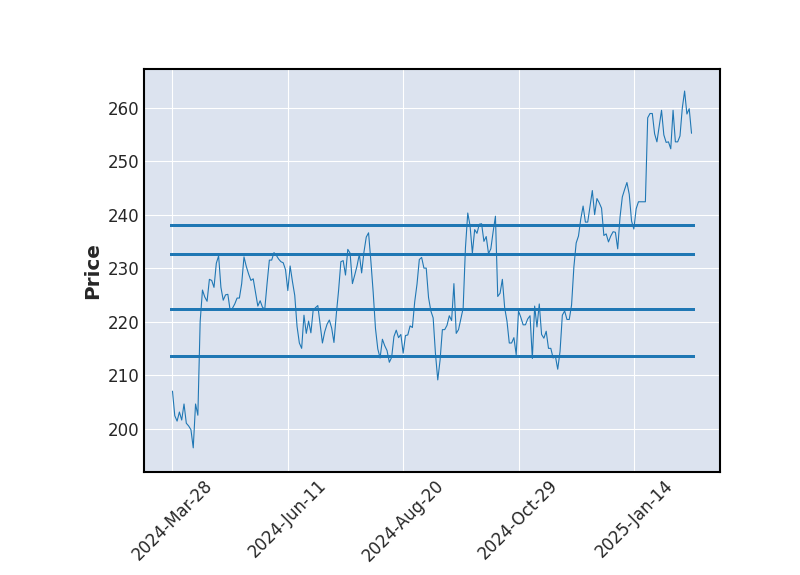
Historique de cours - ADIDAS
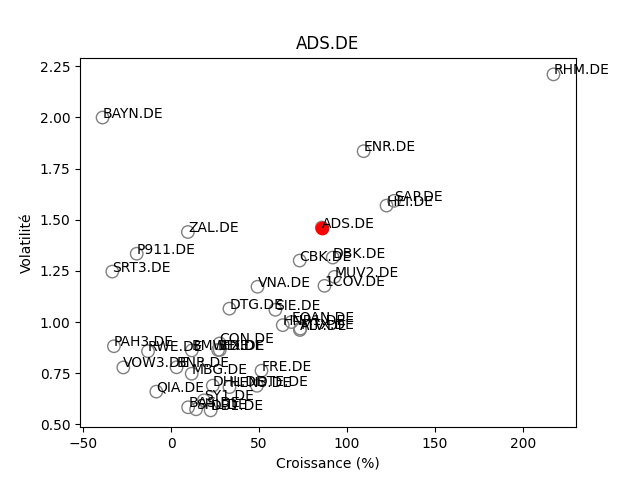
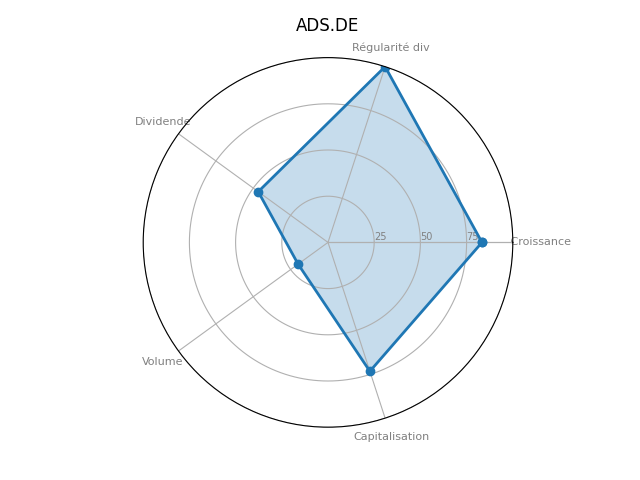
Positionnement boursier de ADIDAS
Version Beta