| Action | MMA | MACD_MME | Bollinger | Stochastique | RSI | Chandelier |
|---|---|---|---|---|---|---|
| ARKEMA | RAS | RAS | RAS | Neutre | RAS | Neutre | RAS |
ARKEMA : 55.75
| 1j | 5j | 1m | 3m | 1a |
|---|---|---|---|---|
| -1.5% | -0.62% | -3.21% | -10.51% | -12.55% |
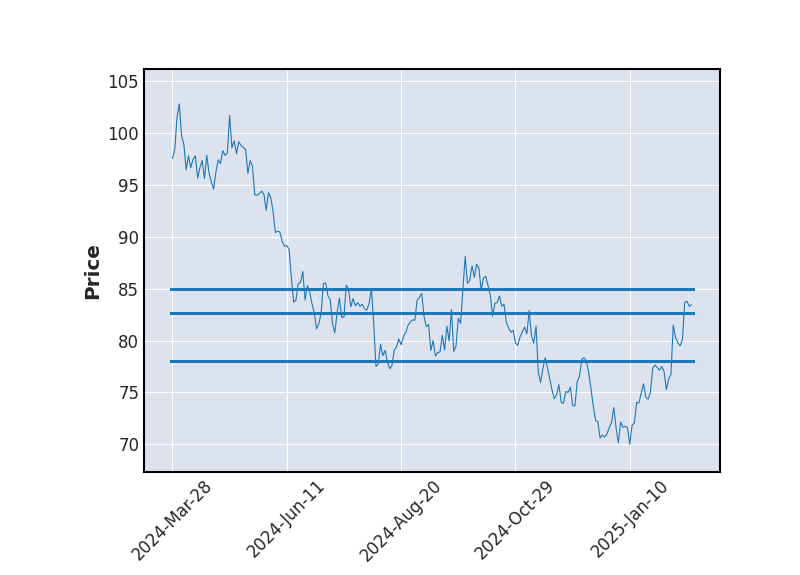
Evolution annuelle
Min : 48.3Moy : 56.61Max : 67.05
|
55.75
| Court terme | Moyen terme | Long terme |
|---|---|---|
 | |  |


Analyse Boursicot du 17/07/2026
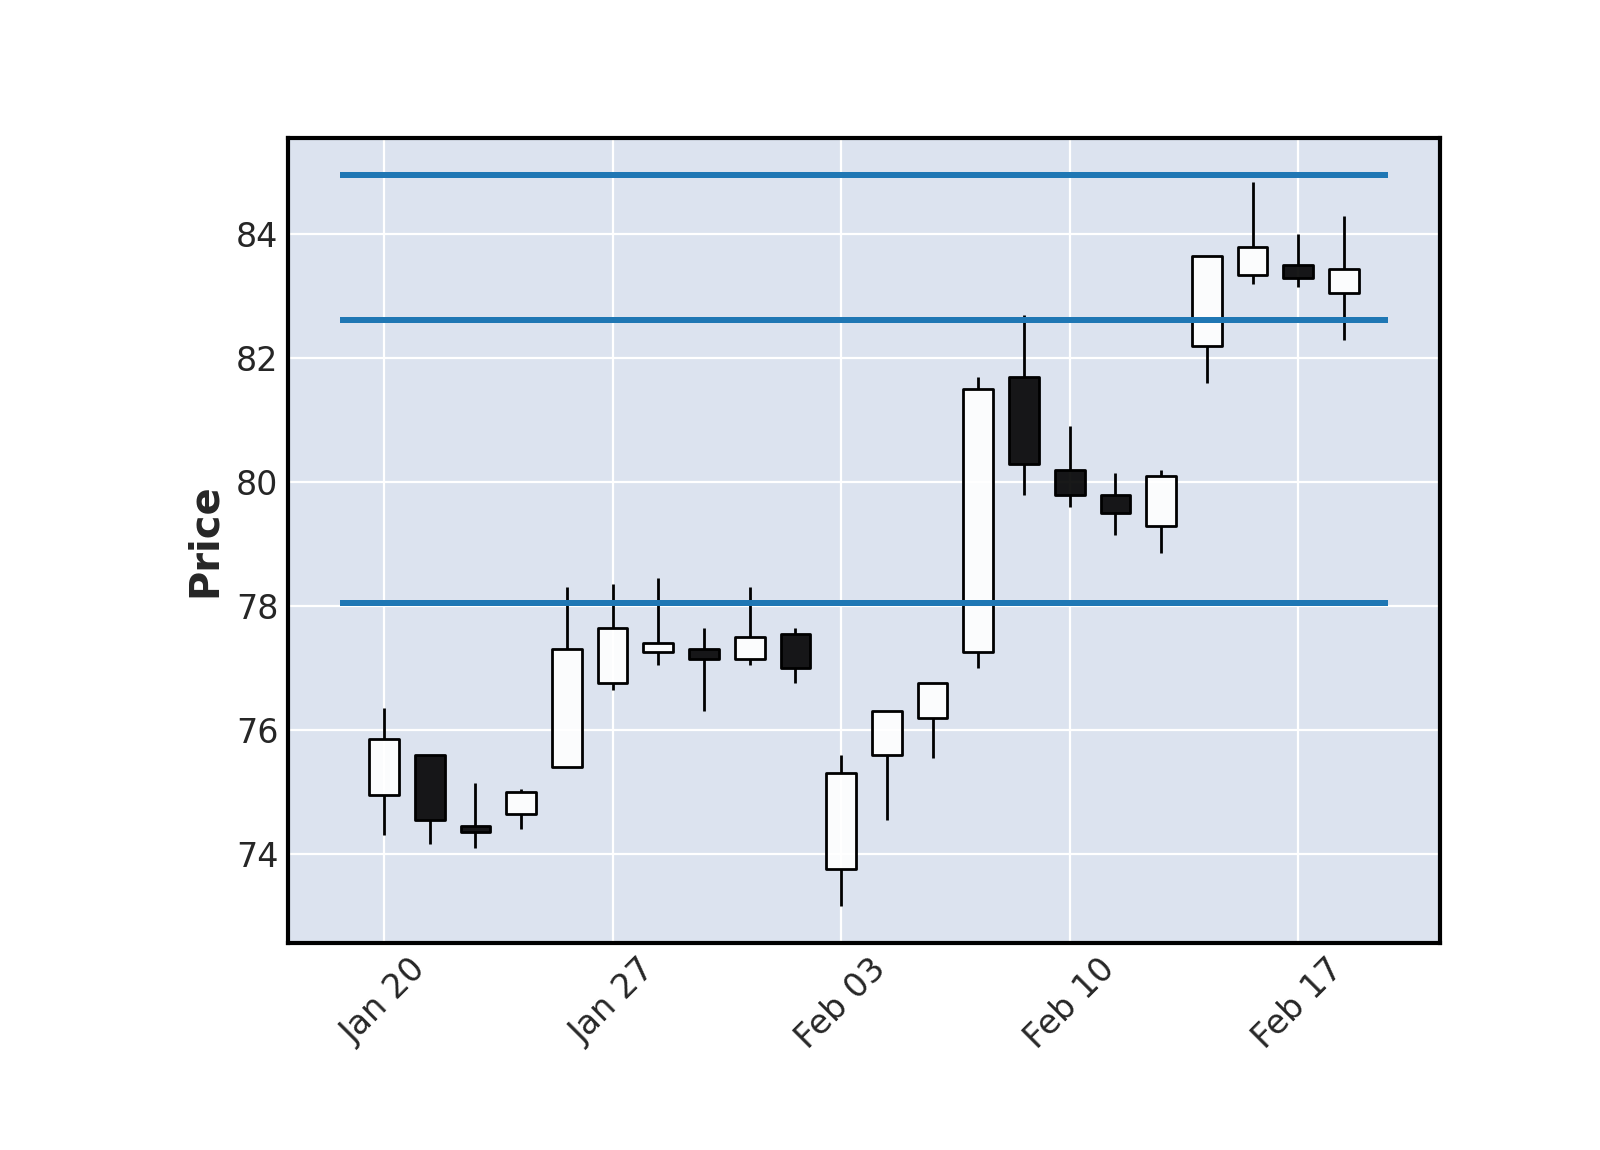
Graphique boursier
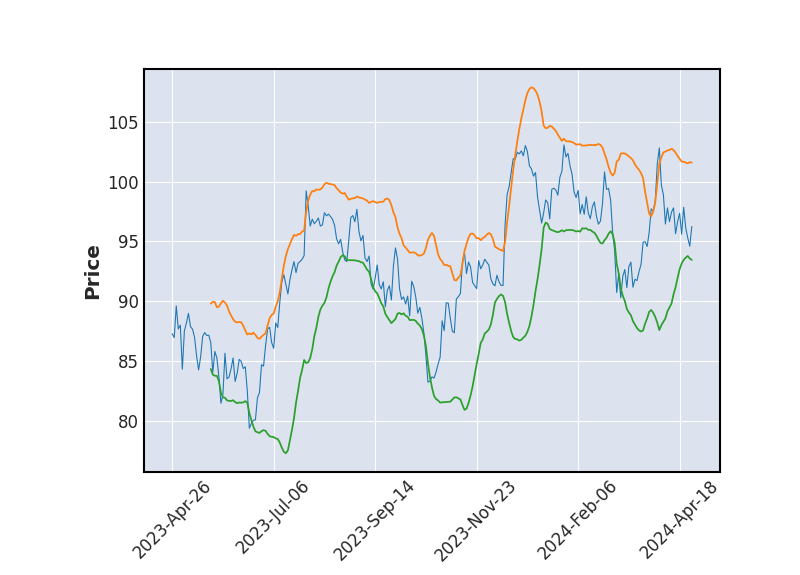 Bollinger
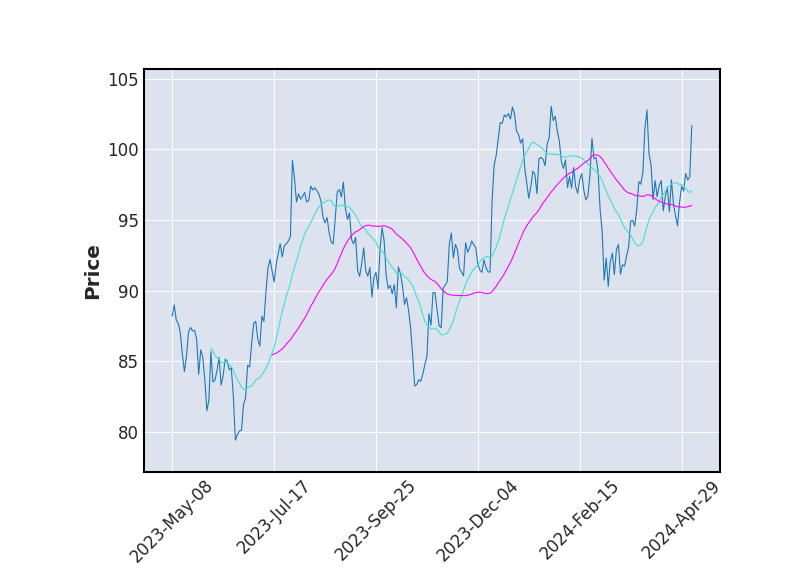 Moyenne Mobile
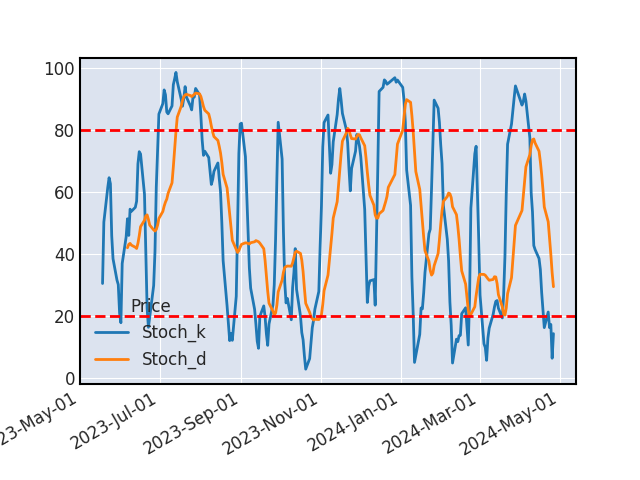 Stochastique
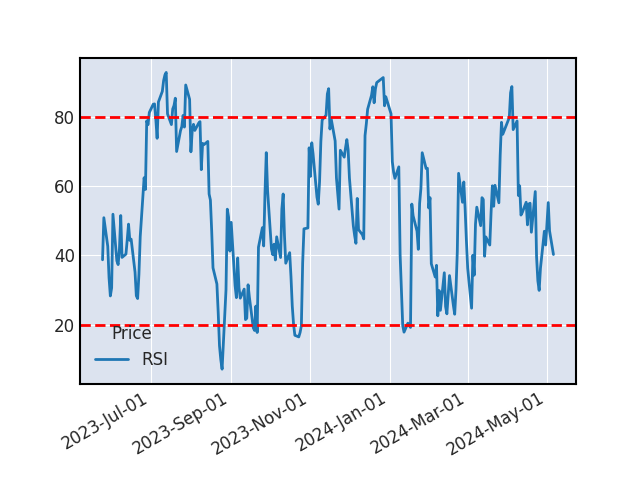 RSI
RSILe titre ne donne aucun signal d'achat ou de vente.
SUPPORTS ET RESISTANCES
| Support Résistance | Rebond | Ecart avec le cours |
|---|---|---|
| 65.32 | 2 | 17.17% |
| 61.87 | 4 | 10.97% |
| 59.17 | 4 | 6.13% |
| 57.38 | 3 | 2.91% |
| 53.47 | 7 | -4.1% |
| 52.18 | 3 | -6.41% |
| 50.42 | 3 | -9.55% |
| 49.13 | 3 | -11.87% |
Historique de cours - ARKEMA
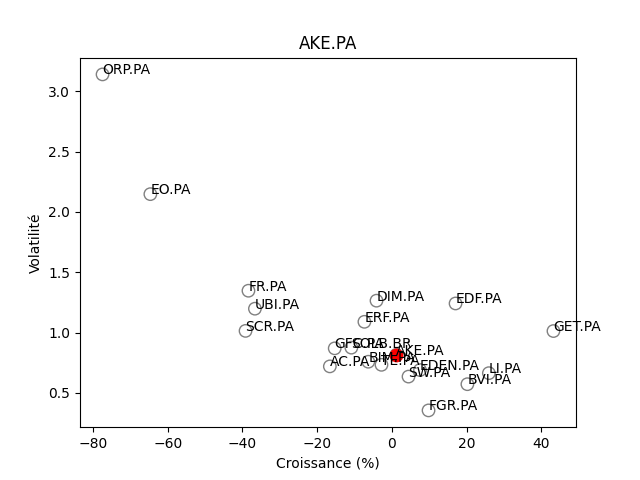
Positionnement boursier de ARKEMA

Version Beta