| Action | MMA | MACD_MME | Bollinger | Stochastique | RSI | Chandelier |
|---|---|---|---|---|---|---|
| BEIERSDORF | Signal ↑↑ : 0.0032% | RAS | RAS | Neutre | Signal ↓↓↓ : -11.98% | Neutre | RAS |
BEIERSDORF : 94.84
| 1j | 5j | 1m | 3m | 1a |
|---|---|---|---|---|
| 1.07% | 0% | 0% | 0% | -12.99% |
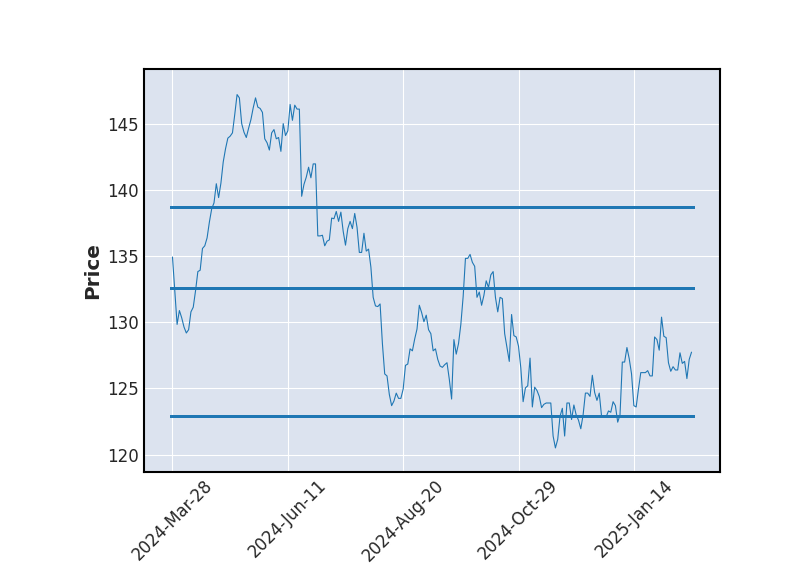
Evolution annuelle
Min : 87.02Moy : 94.33Max : 110.7
|
94.84
| Court terme | Moyen terme | Long terme |
|---|---|---|
 |  | |


Analyse Boursicot du 06/01/2026
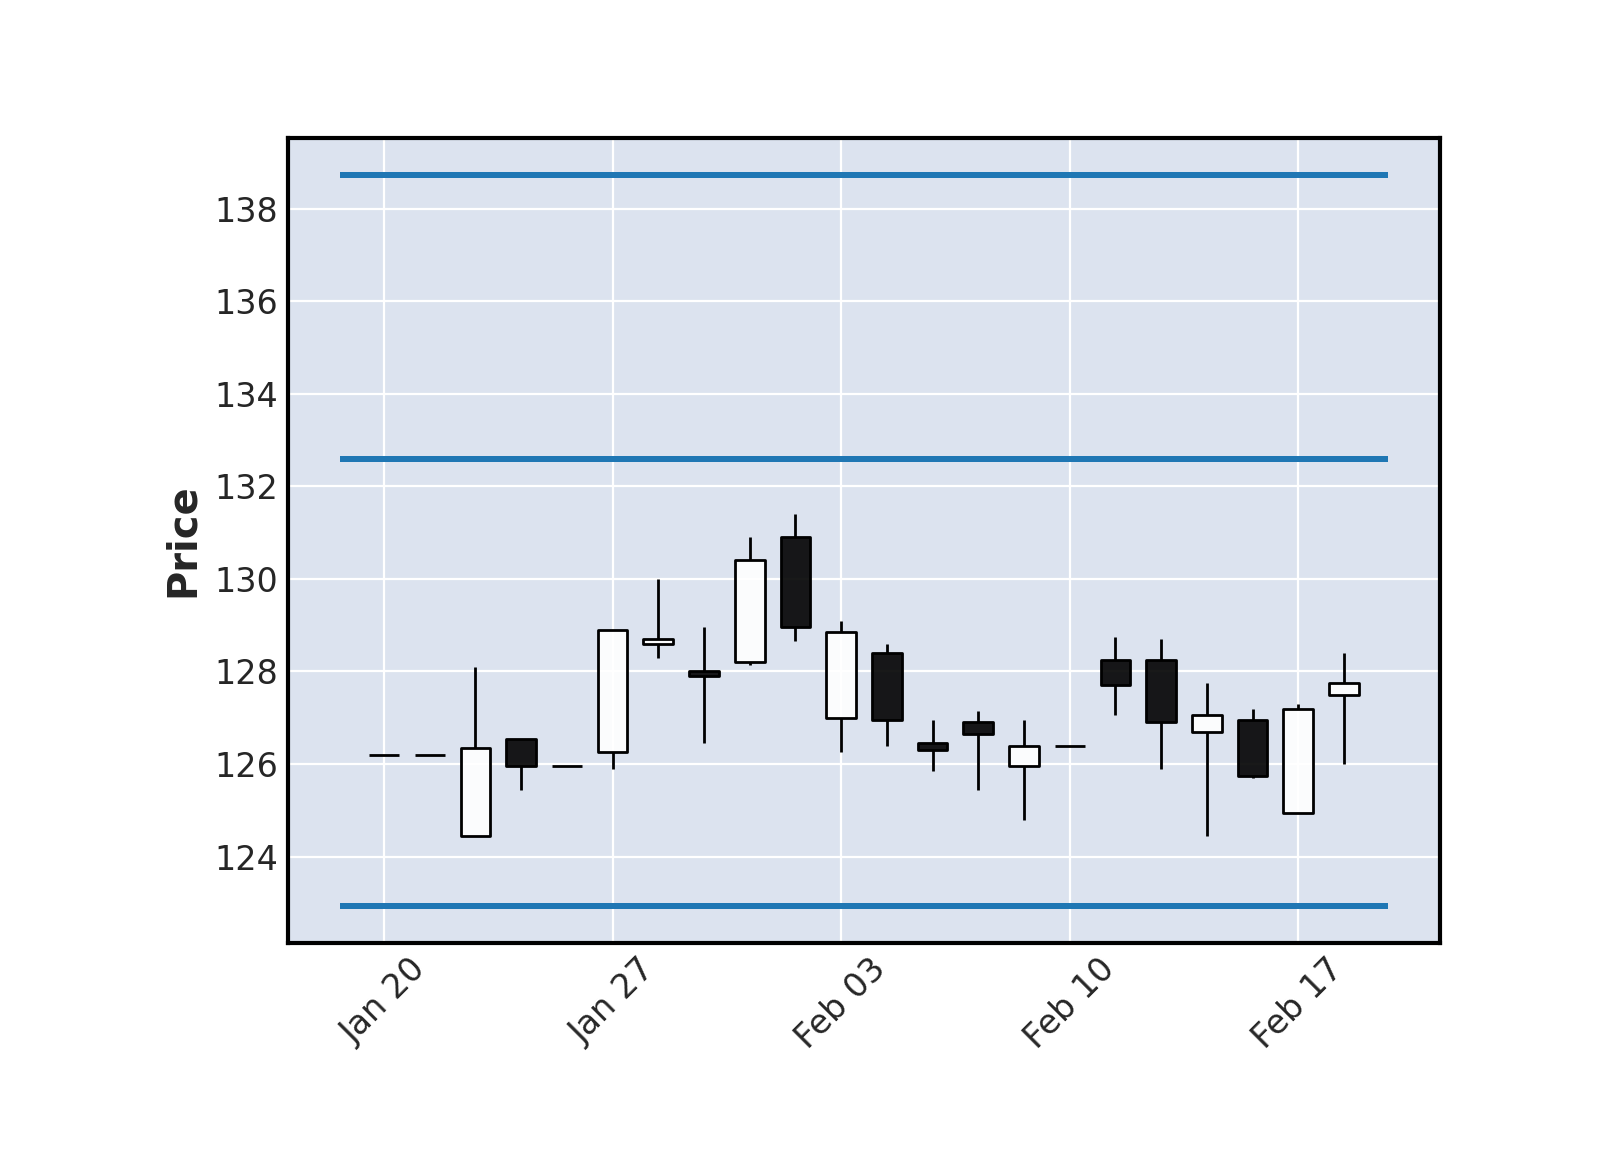
Graphique boursier
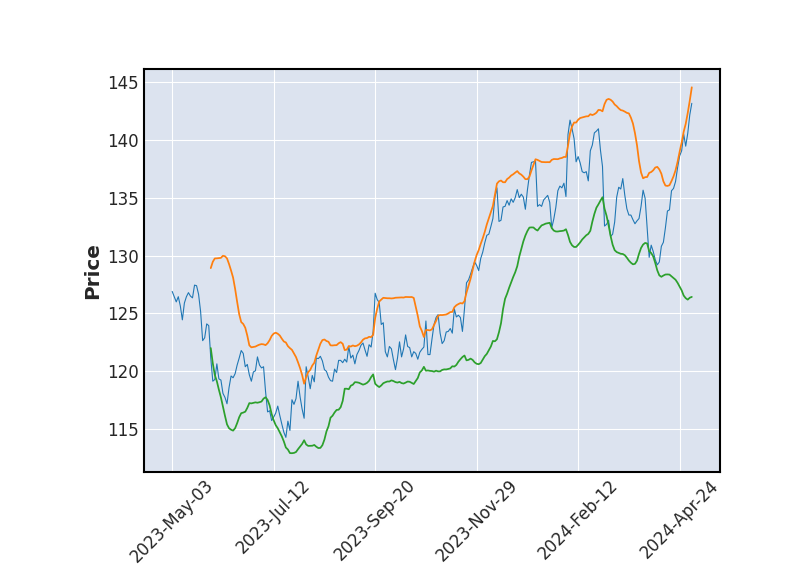 Bollinger
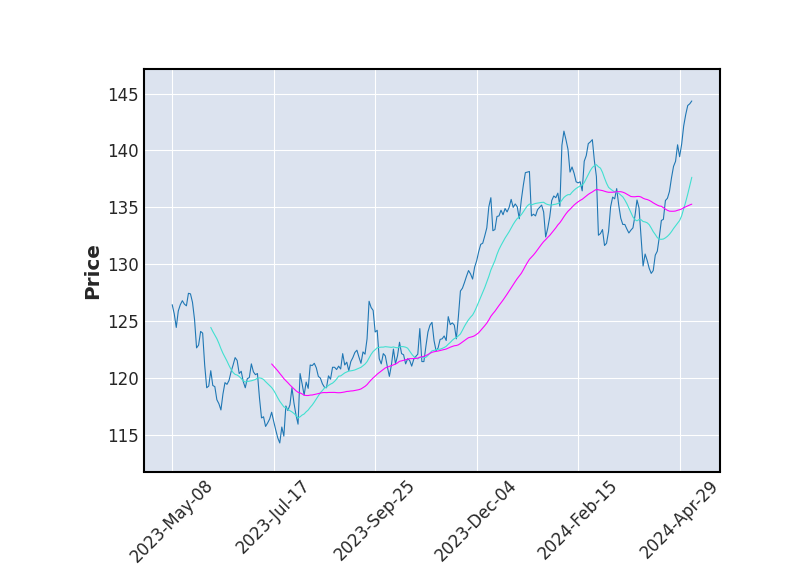 Moyenne Mobile
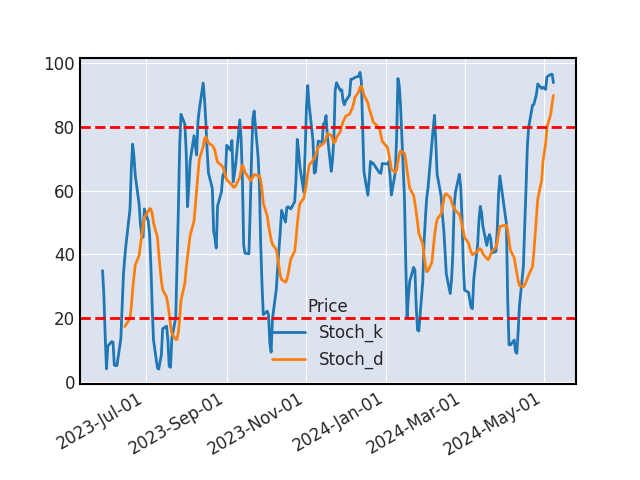 Stochastique
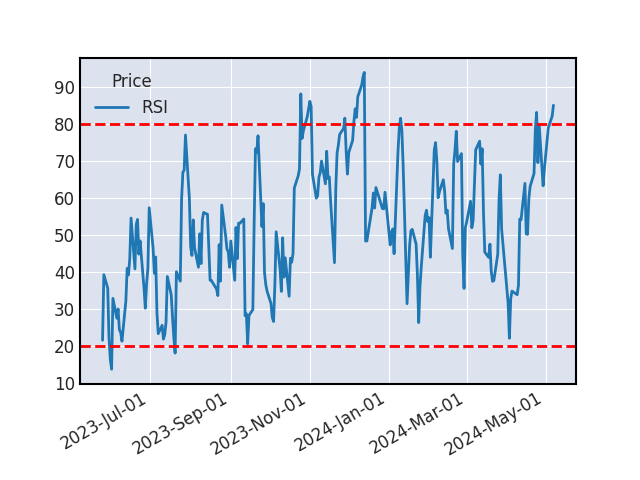 RSI
RSIMMA
La hausse semble se confirmer à nouveau aujourd'hui, suite au croisement hier des MMA 20 et 50, ainsi que l'accélération de leur divergence.
STOCHASTIQUE
Une baisse devrait survenir sur le titre suite au croisement du stochastique %K et de son signal %D en cas de confirmation par un autre indicateur technique.
La prudence est de mise sur le titre BEIERSDORF, l'analyse technique nous envoyant des signaux contraires.
SUPPORTS ET RESISTANCES
| Support Résistance | Rebond | Ecart avec le cours |
|---|---|---|
| 126.2 | 5 | 33.07% |
| 93.82 | 3 | -1.08% |
| 87.53 | 3 | -7.71% |
Historique de cours - BEIERSDORF
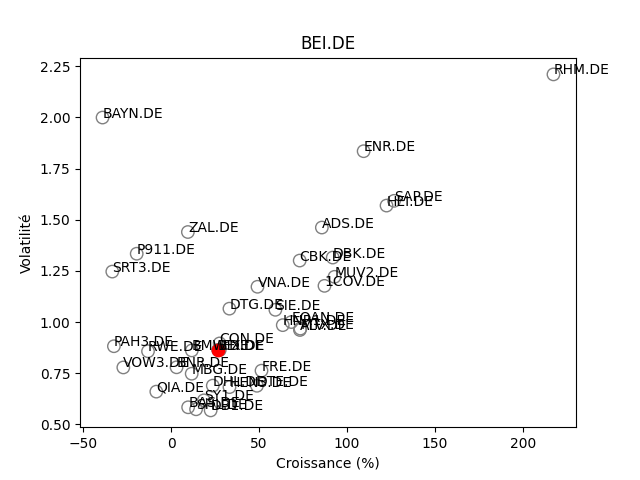
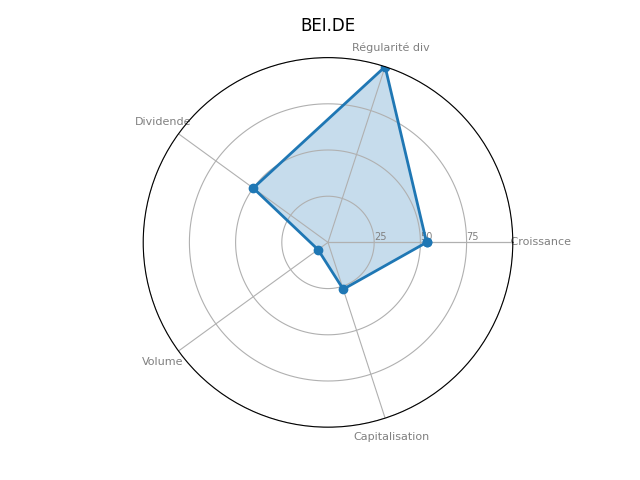
Positionnement boursier de BEIERSDORF
Version Beta