| Action | MMA | MACD_MME | Bollinger | Stochastique | RSI | Chandelier |
|---|---|---|---|---|---|---|
| CHECK POINT SOFTWARE | RAS | Signal ↓ : -0.0662% | RAS | Sur-achat↓ | Signal ↓ : -9.12% | Neutre | RAS |
CHECK POINT SOFTWARE : 196.24
| 1j | 5j | 1m | 3m | 1a |
|---|---|---|---|---|
| -0.15% | 0% | 0% | 0% | -10.36% |
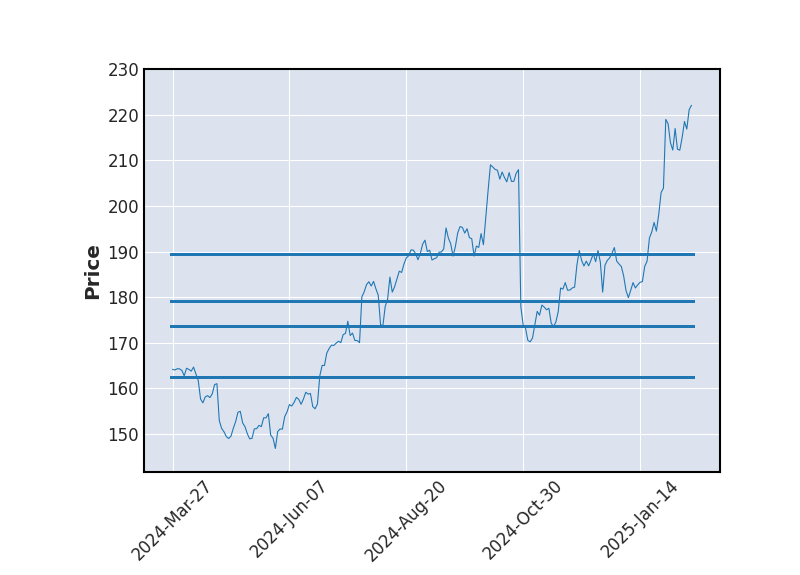
Evolution annuelle
Min : 178.68Moy : 202.66Max : 232.07
|
196.24
| Court terme | Moyen terme | Long terme |
|---|---|---|
 |  | |


Analyse Boursicot du 18/09/2025
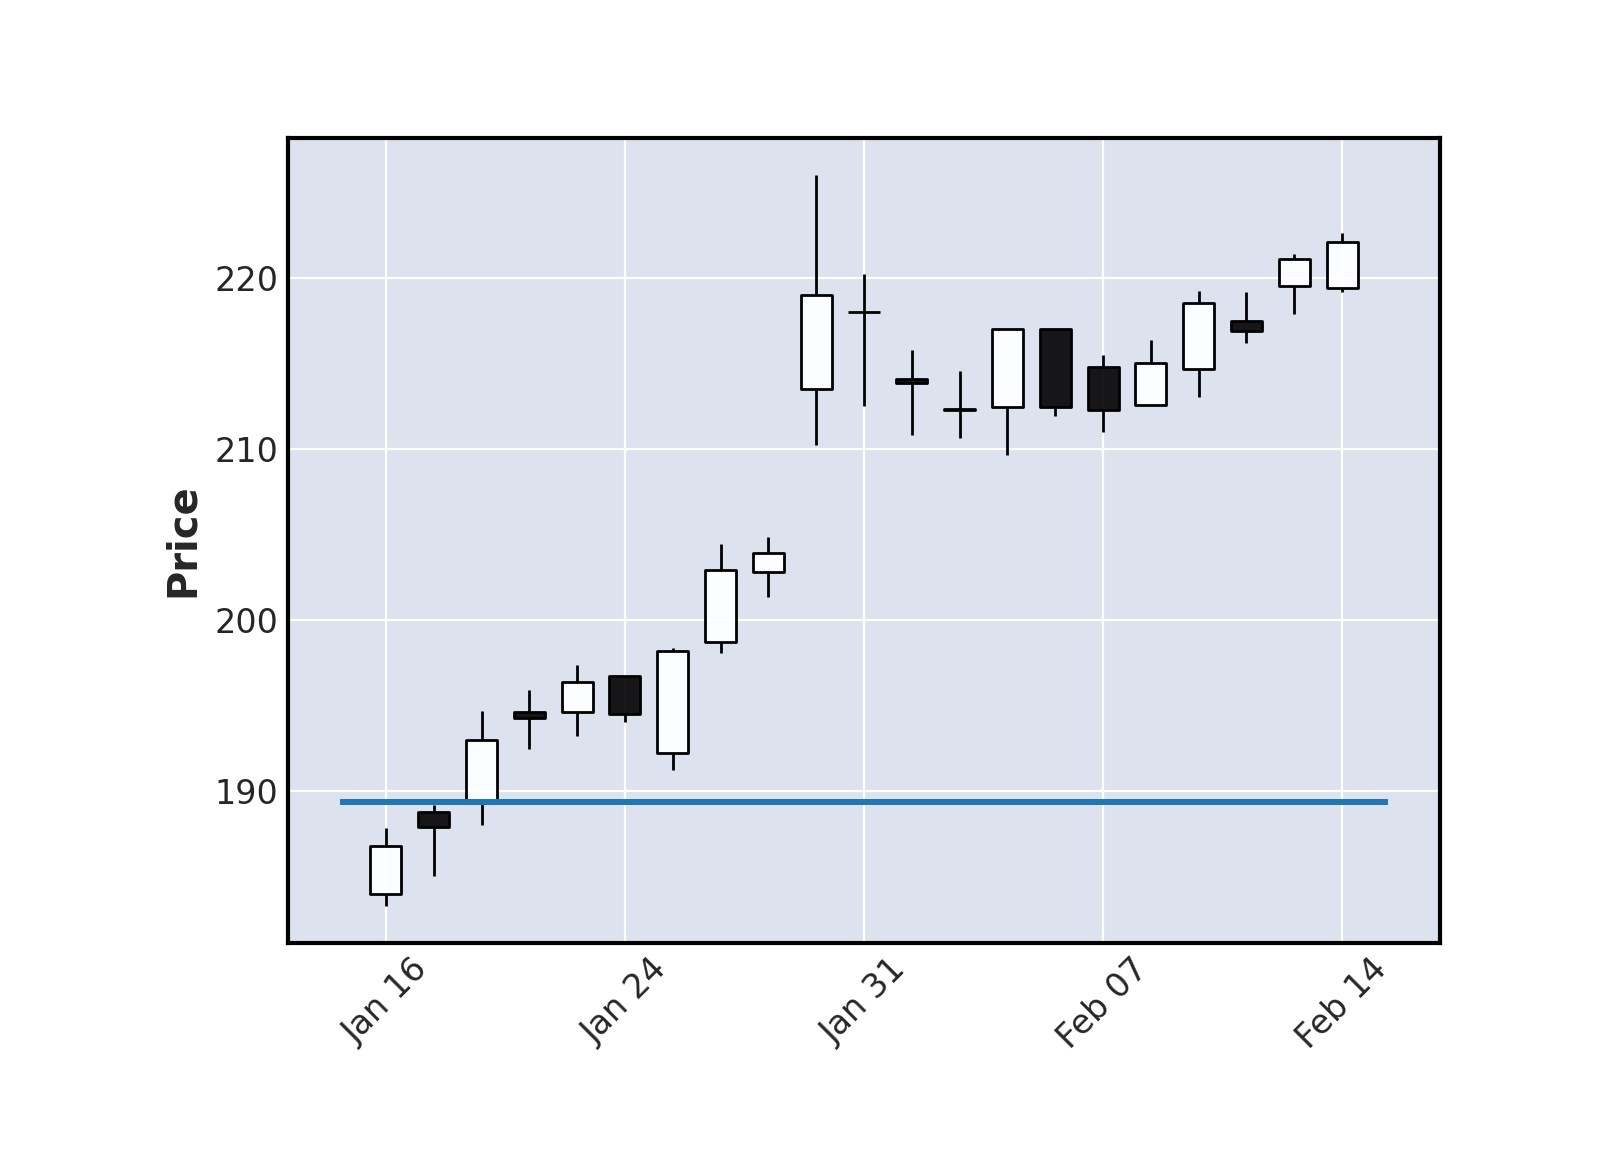
Graphique boursier
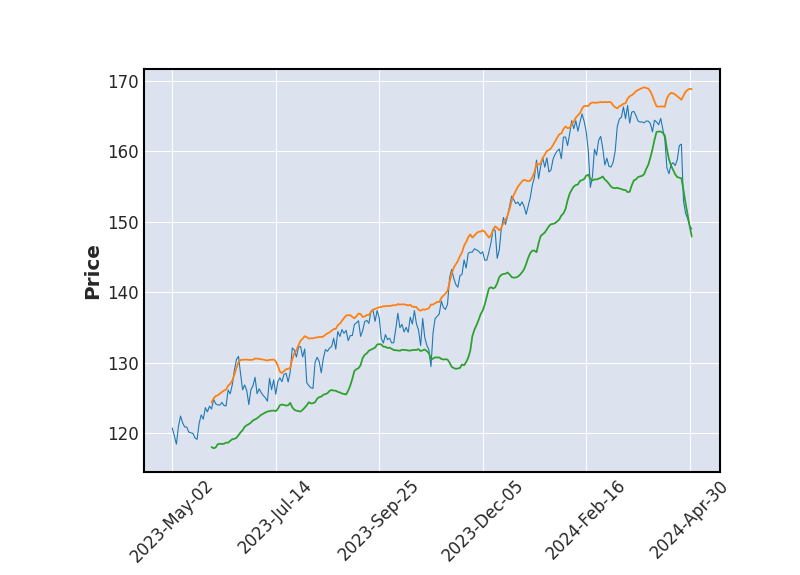 Bollinger
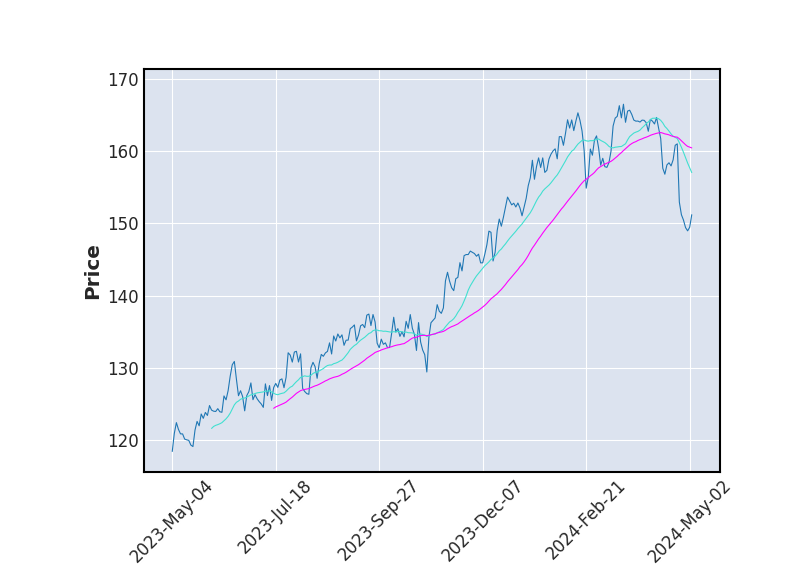 Moyenne Mobile
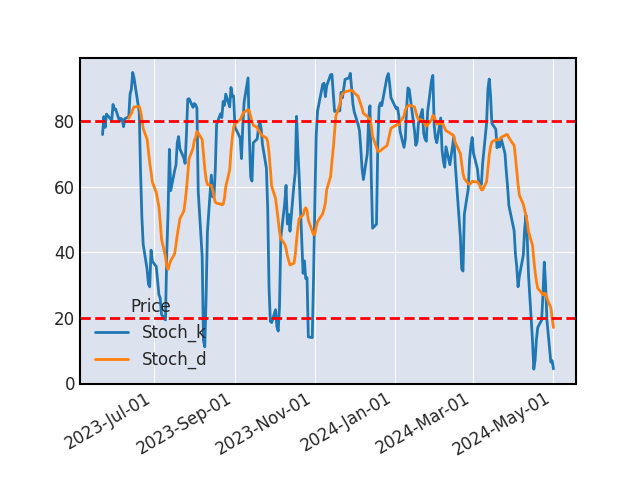 Stochastique
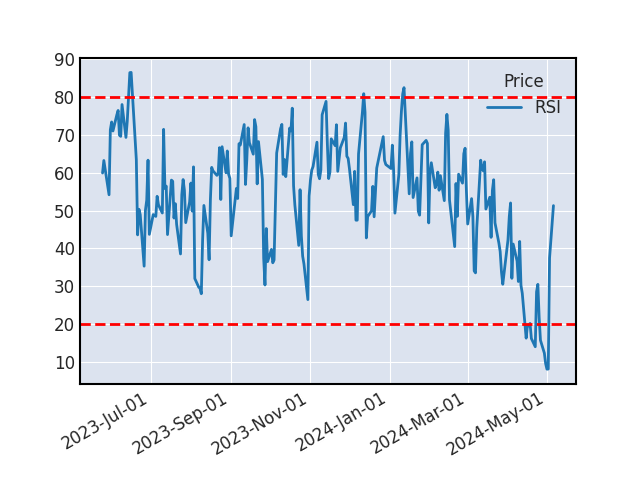 RSI
RSIMACD
Une baisse semble se dessiner aujourd'hui pour l'action CHECK POINT SOFTWARE, suite au croisement des MACD et de son signal, l'action est donc à surveiller pour valider le signal.
STOCHASTIQUE
L’action CHECK POINT SOFTWARE était sur-achetée, le stochastique vient de revenir sous les 80. Une baisse du cours est à prévoir. Une baisse devrait survenir sur le titre suite au croisement du stochastique %K et de son signal %D en cas de confirmation par un autre indicateur technique.
SUPPORTS ET RESISTANCES
| Support Résistance | Rebond | Ecart avec le cours |
|---|---|---|
| 231.32 | 5 | 17.88% |
| 221.86 | 6 | 13.06% |
| 215.02 | 5 | 9.57% |
| 208.08 | 3 | 6.03% |
| 189.26 | 5 | -3.56% |
| 179.62 | 4 | -8.47% |
Historique de cours - CHECK POINT SOFTWARE
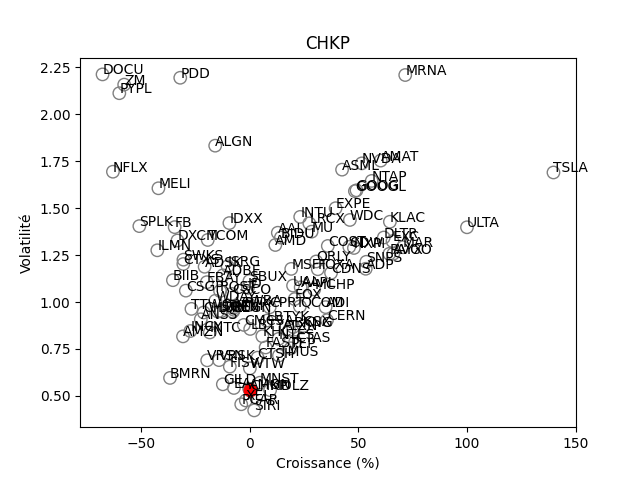
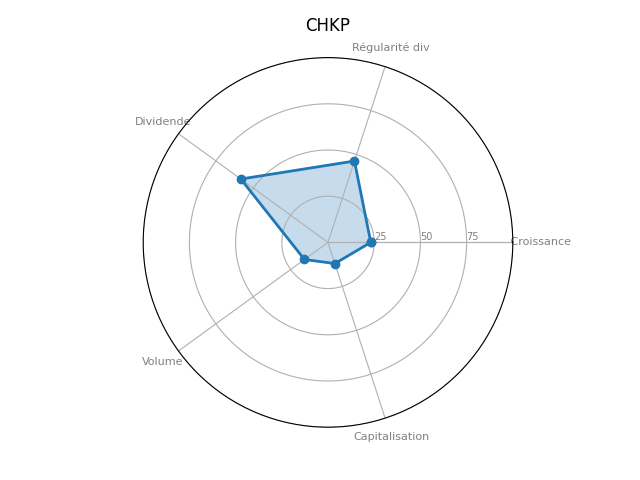
Positionnement boursier de CHECK POINT SOFTWARE
Version Beta