| Action | MMA | MACD_MME | Bollinger | Stochastique | RSI | Chandelier |
|---|---|---|---|---|---|---|
| EBAY | RAS | Signal ↑ : 0.0372% | RAS | Neutre | RAS | Neutre | RAS |
EBAY : 89.6
| 1j | 5j | 1m | 3m | 1a |
|---|---|---|---|---|
| -0.4% | 0% | 0% | 0% | 13.37% |
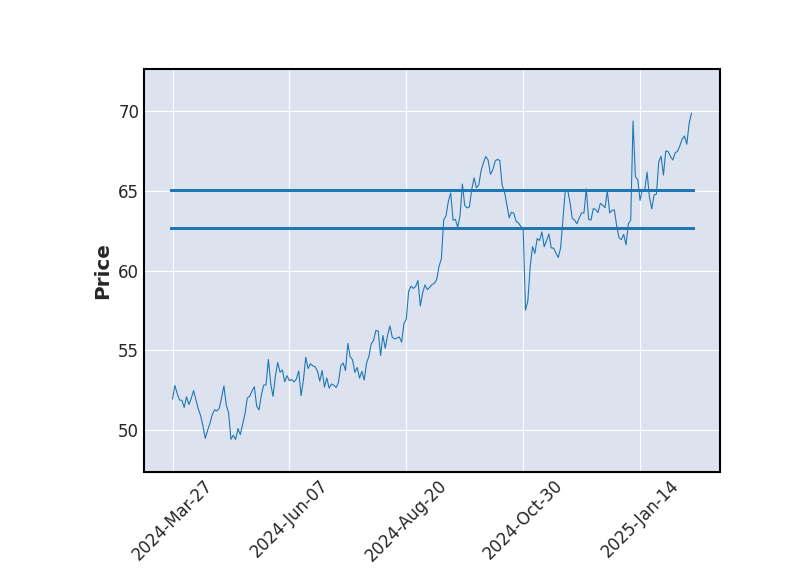
Evolution annuelle
Min : 77.12Moy : 91.41Max : 101.15
|
89.6
| Court terme | Moyen terme | Long terme |
|---|---|---|
 |  | |


Analyse Boursicot du 18/09/2025
Graphique boursier
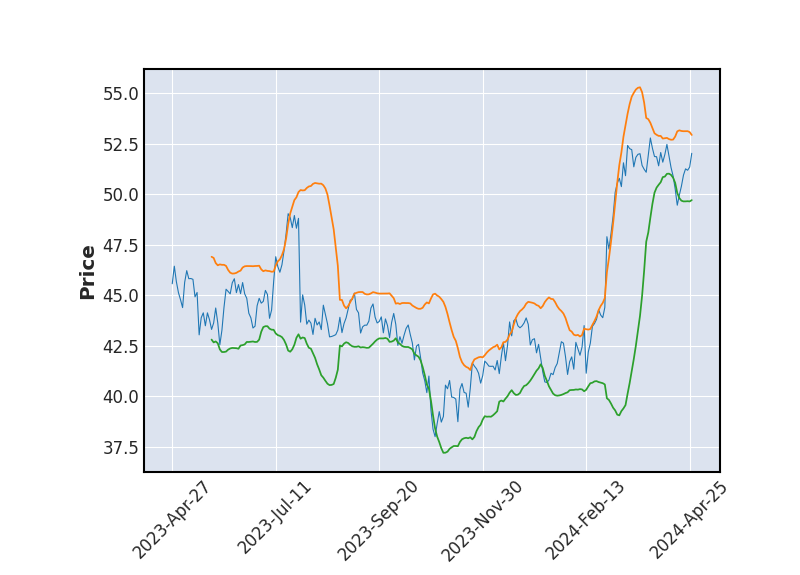 Bollinger
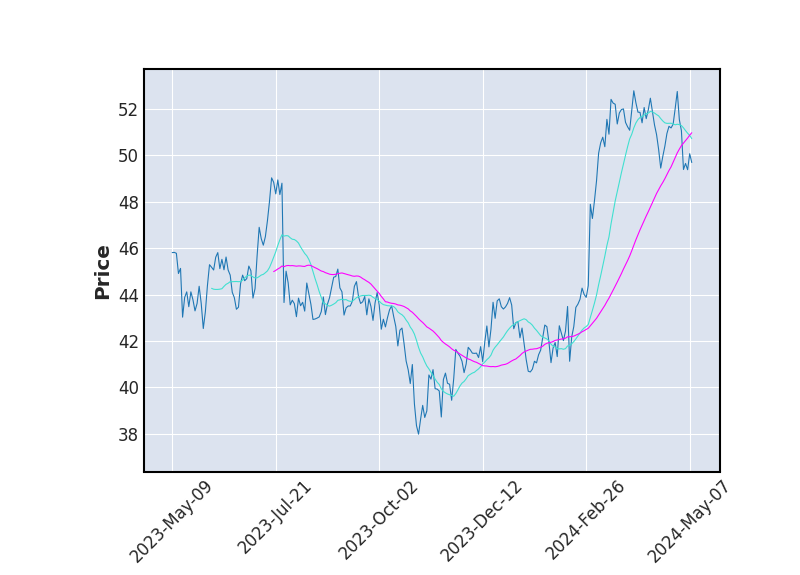 Moyenne Mobile
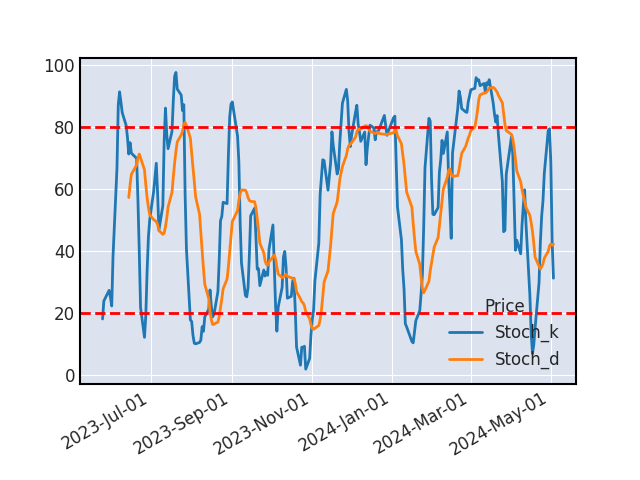 Stochastique
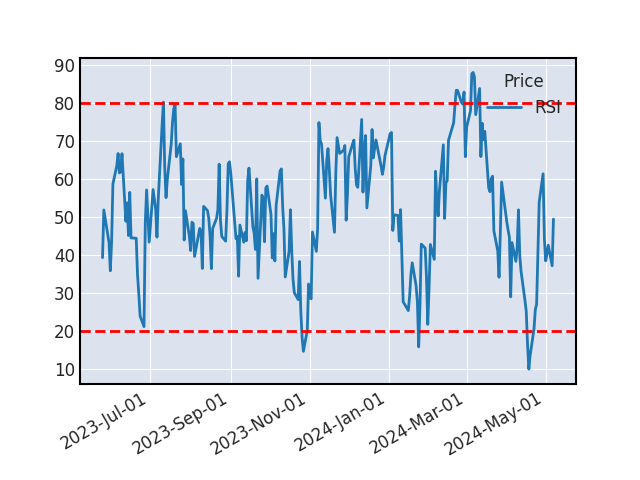 RSI
RSIMACD
La MACD et son signal viennent de se croiser, une hausse pourrait se confirmer sur les jours à venir. L'action est à surveiller.
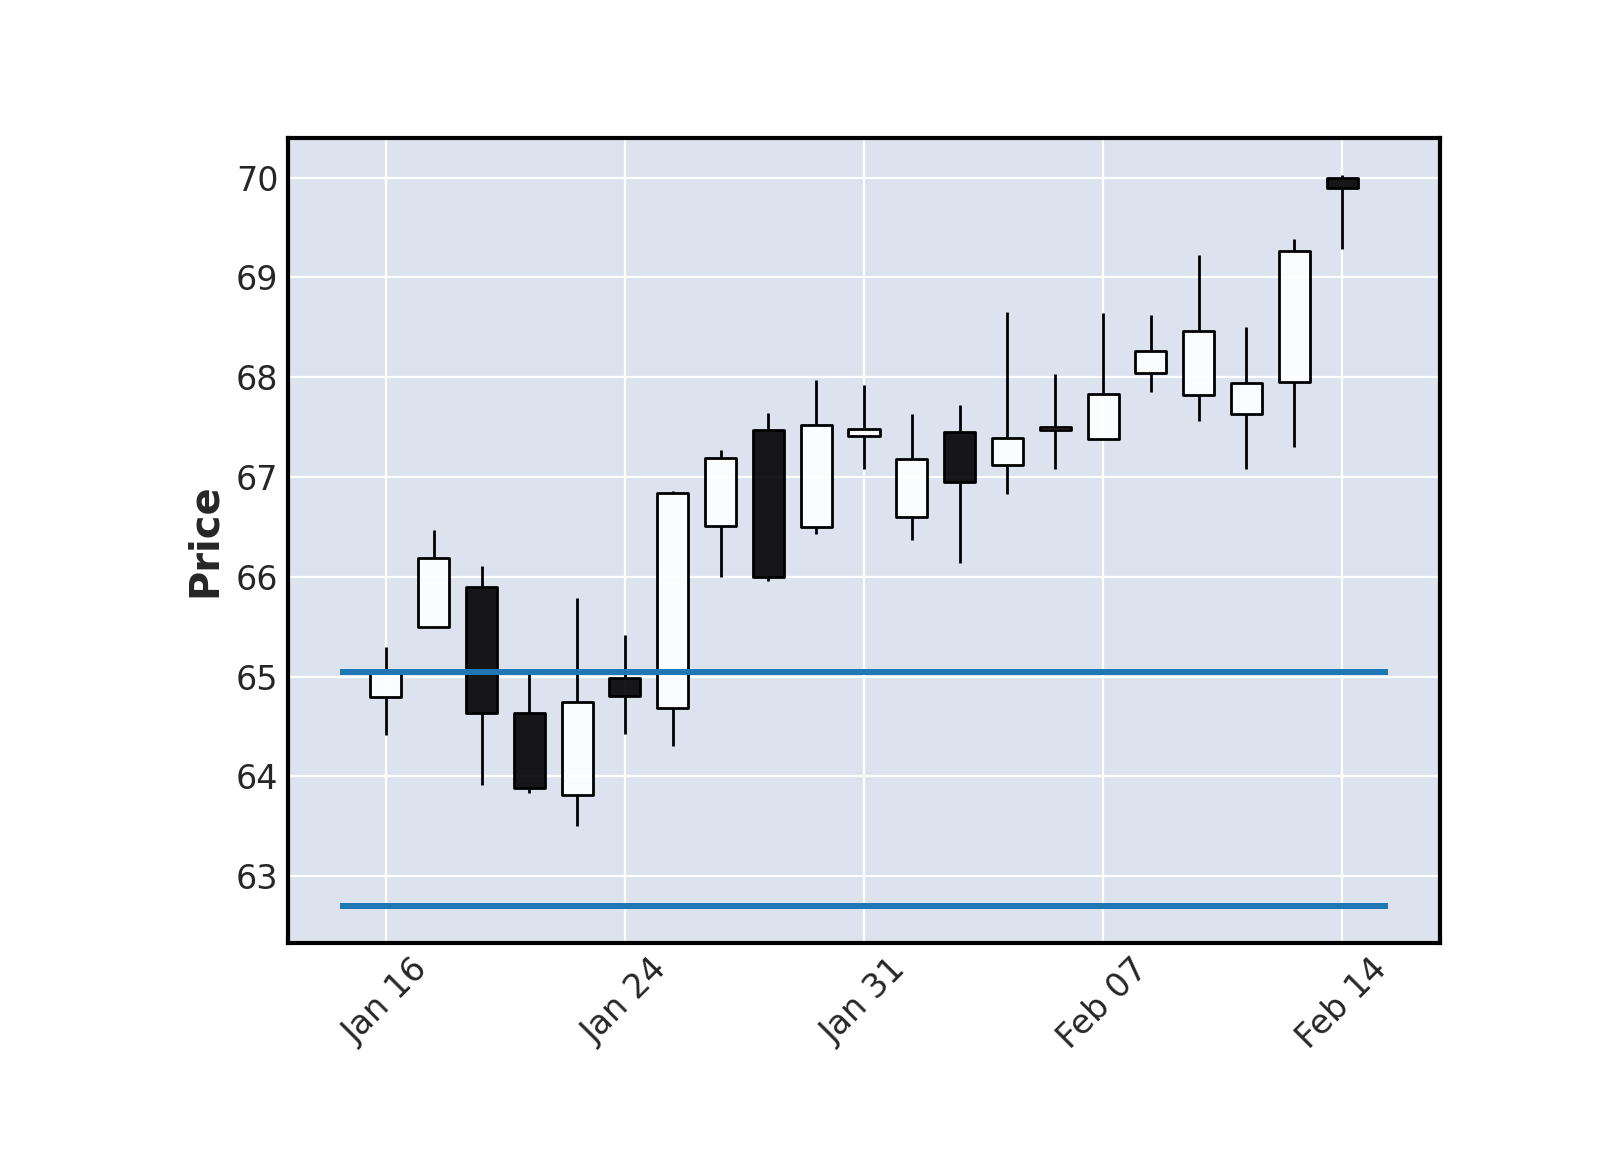
SUPPORTS ET RESISTANCES
| Support Résistance | Rebond | Ecart avec le cours |
|---|---|---|
| 67.34 | 3 | -24.84% |
| 65.08 | 4 | -27.37% |
| 63.18 | 6 | -29.49% |
Historique de cours - EBAY
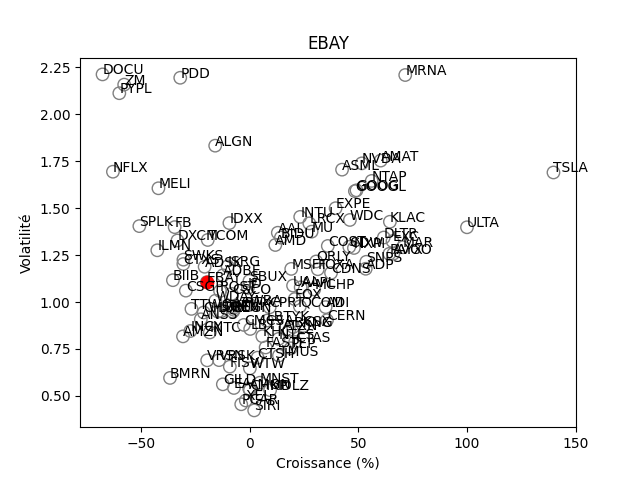
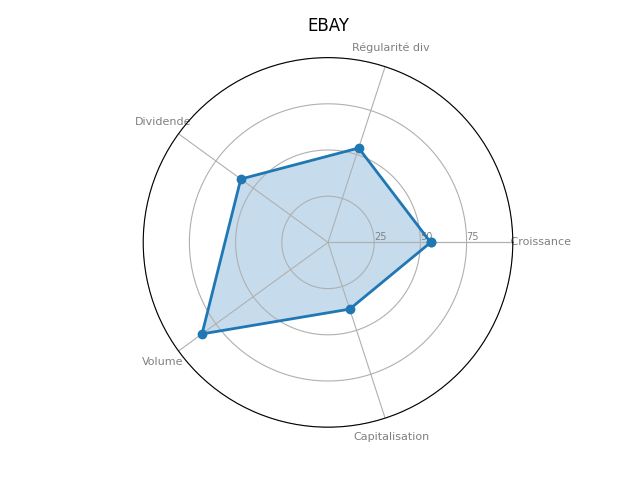
Positionnement boursier de EBAY
Version Beta