| Action | MMA | MACD_MME | Bollinger | Stochastique | RSI | Chandelier |
|---|---|---|---|---|---|---|
| E.ON | RAS | RAS | RAS | Neutre | RAS | Neutre | RAS |
E.ON : 16.54
| 1j | 5j | 1m | 3m | 1a |
|---|---|---|---|---|
| 1.22% | 0% | 0% | 0% | 5.42% |
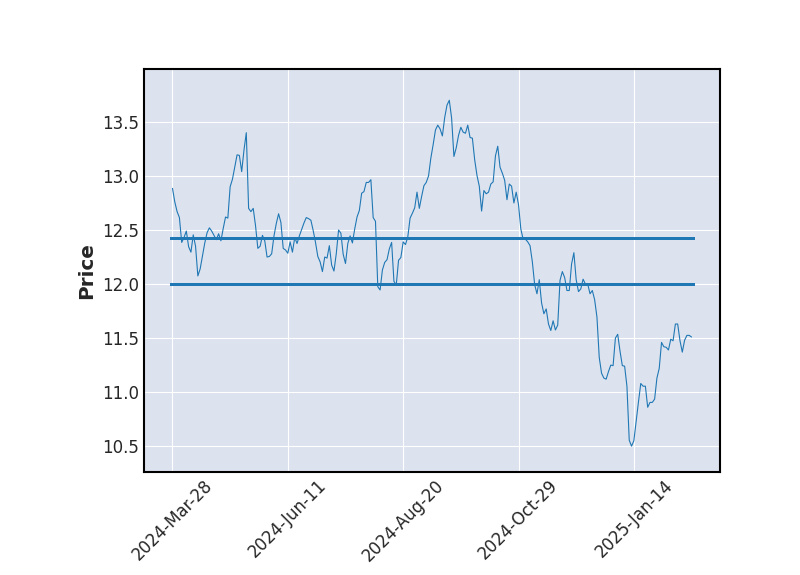
Evolution annuelle
Min : 14.6Moy : 15.77Max : 16.76
|
16.54
| Court terme | Moyen terme | Long terme |
|---|---|---|
 |  | |


Analyse Boursicot du 06/01/2026
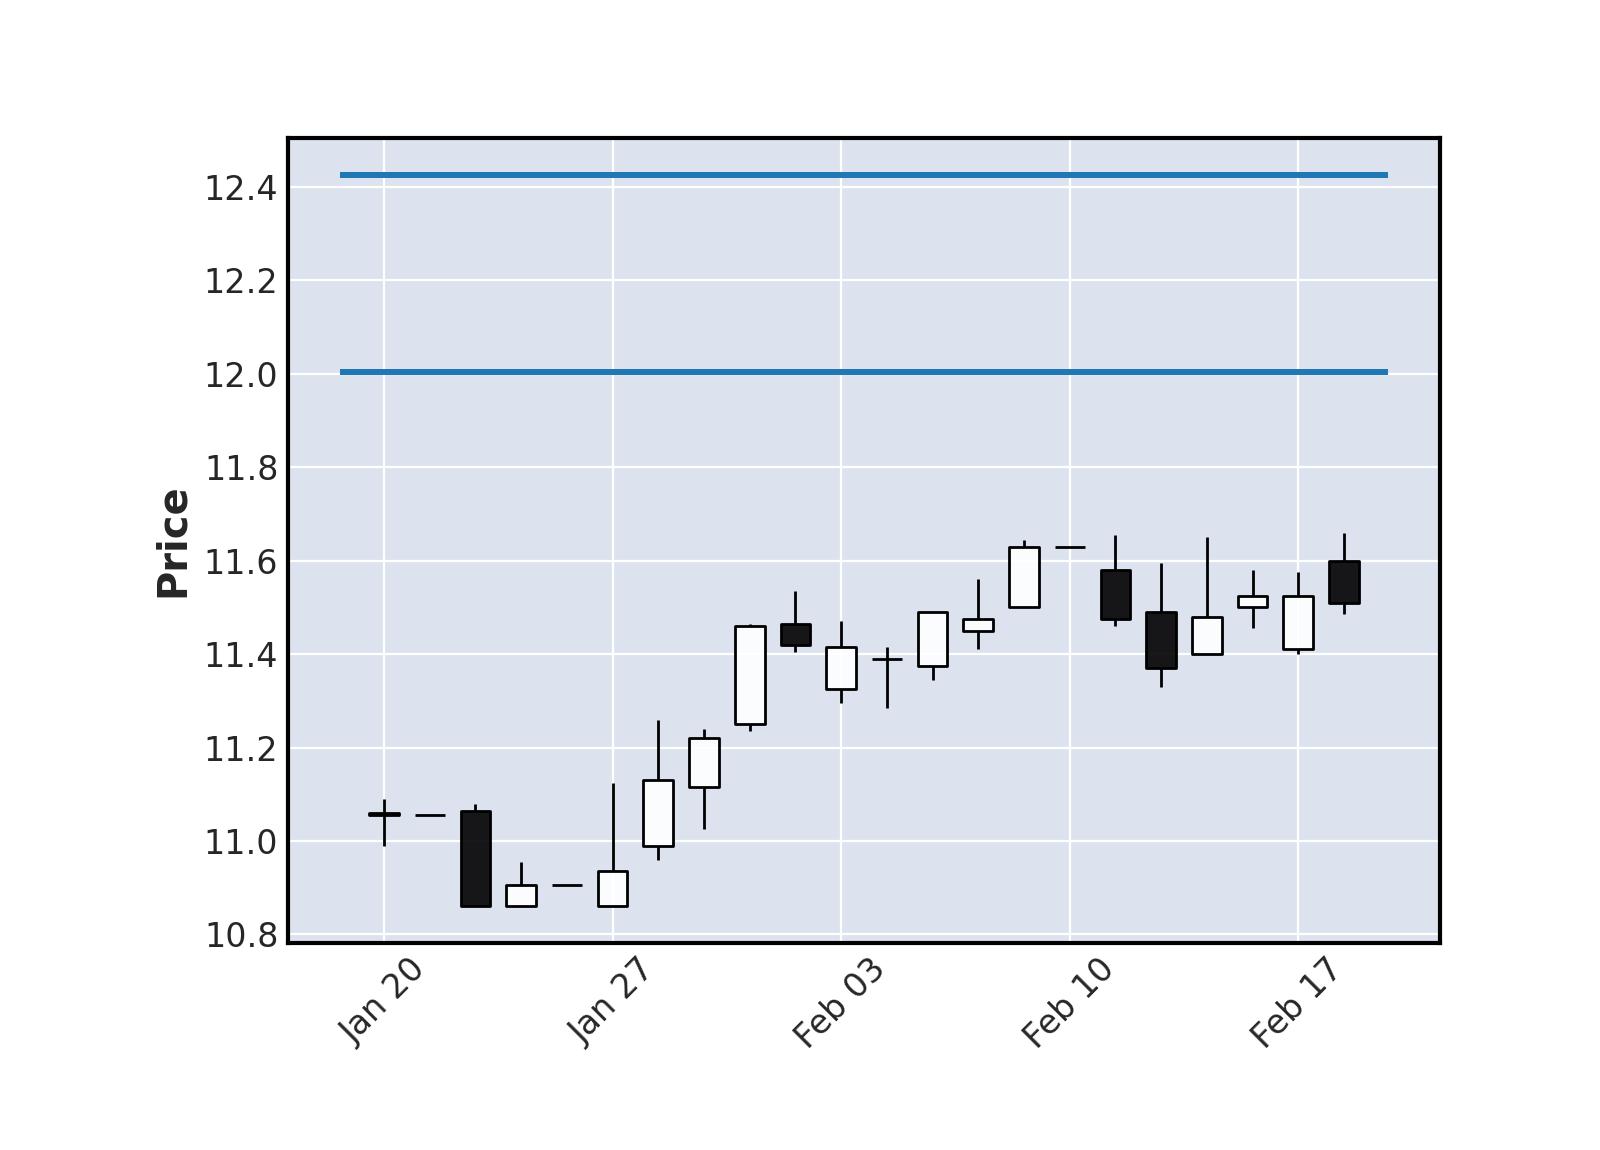
Graphique boursier
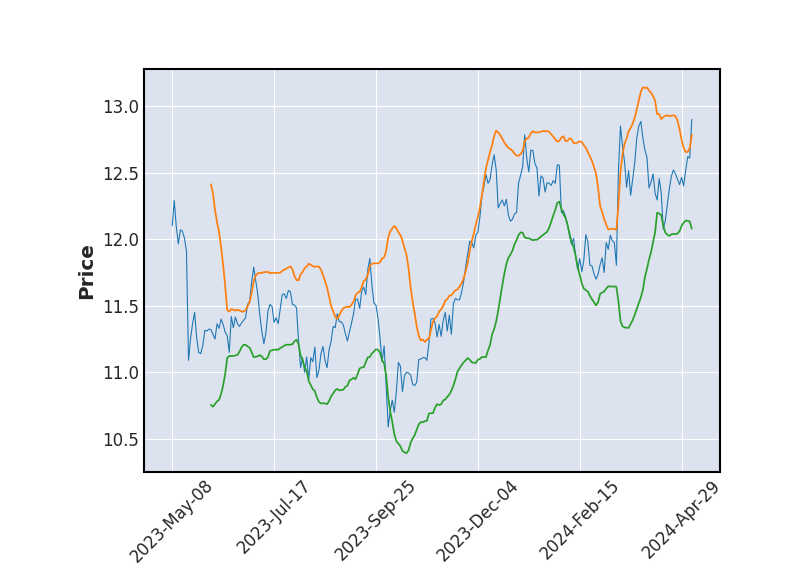 Bollinger
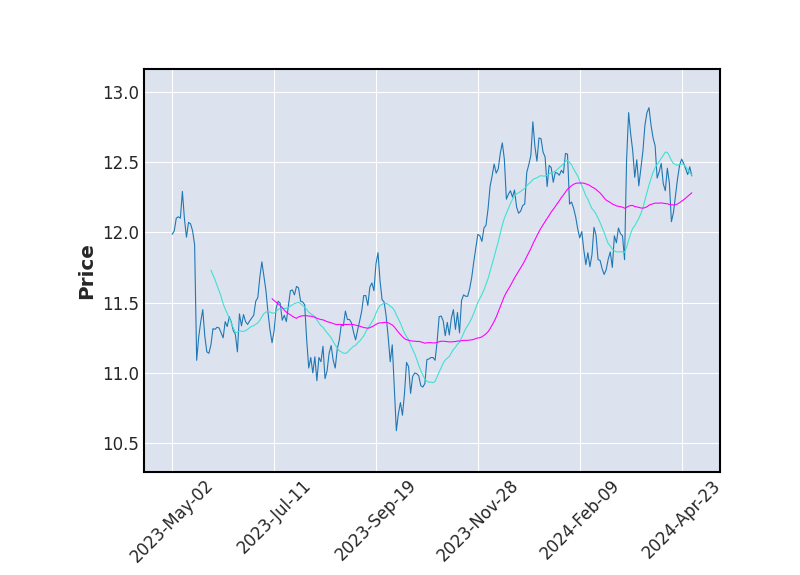 Moyenne Mobile
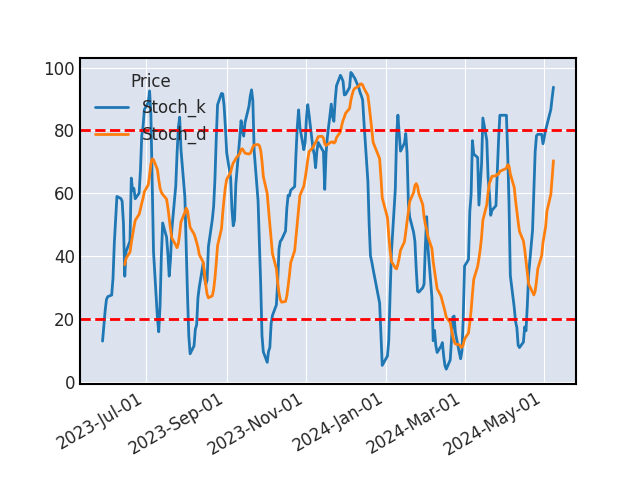 Stochastique
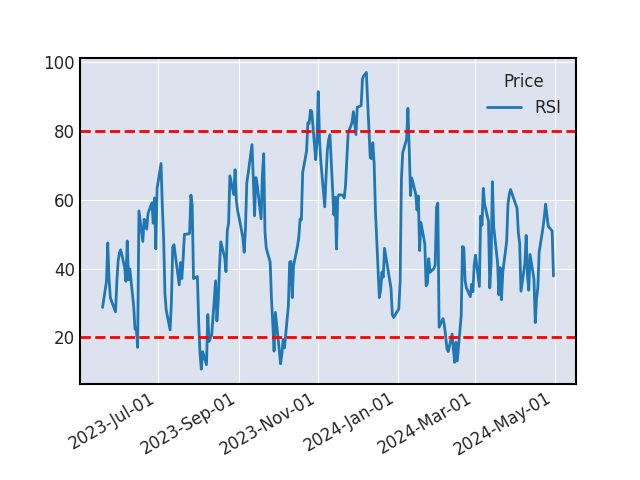 RSI
RSIAucun signal d'achat ou de vente sur le titre aujourd'hui.
SUPPORTS ET RESISTANCES
| Support Résistance | Rebond | Ecart avec le cours |
|---|---|---|
| 16.39 | 4 | -0.94% |
| 16.06 | 3 | -2.92% |
| 15.69 | 11 | -5.12% |
| 15.19 | 3 | -8.15% |
Historique de cours - E.ON
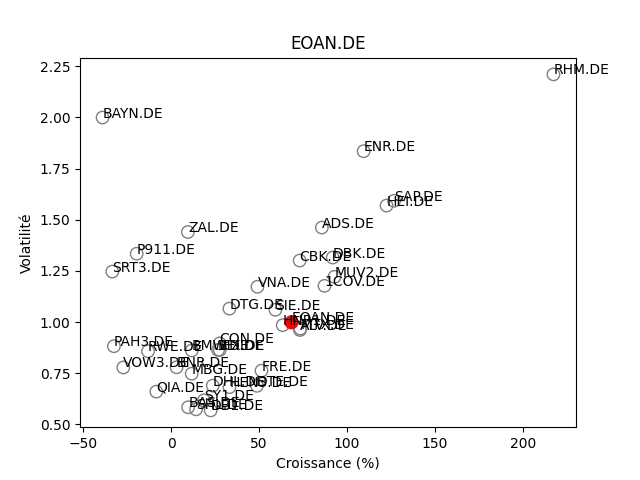
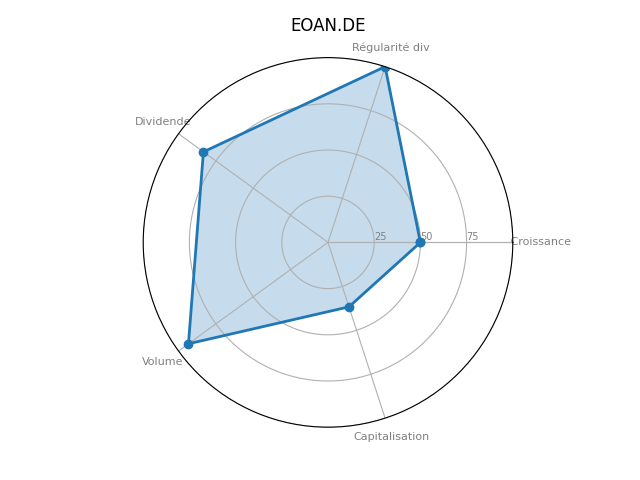
Positionnement boursier de E.ON
Version Beta