| Action | MMA | MACD_MME | Bollinger | Stochastique | RSI | Chandelier |
|---|---|---|---|---|---|---|
| FOX A | RAS | RAS | RAS | Neutre | RAS | Neutre | RAS |
FOX A : 59.84
| 1j | 5j | 1m | 3m | 1a |
|---|---|---|---|---|
| 1.05% | 0% | 0% | 0% | 7.9% |
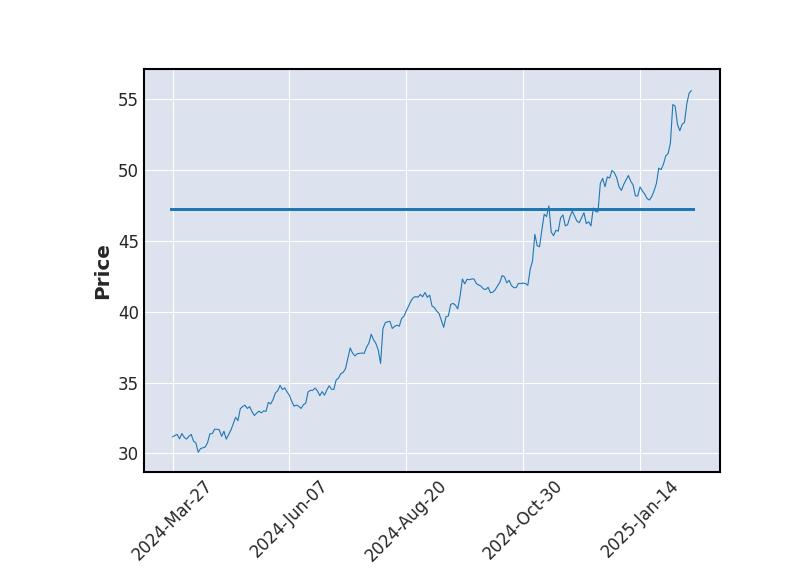
Evolution annuelle
Min : 53.05Moy : 58.19Max : 62.69
|
59.84
| Court terme | Moyen terme | Long terme |
|---|---|---|
 |  | |


Analyse Boursicot du 18/09/2025
Graphique boursier
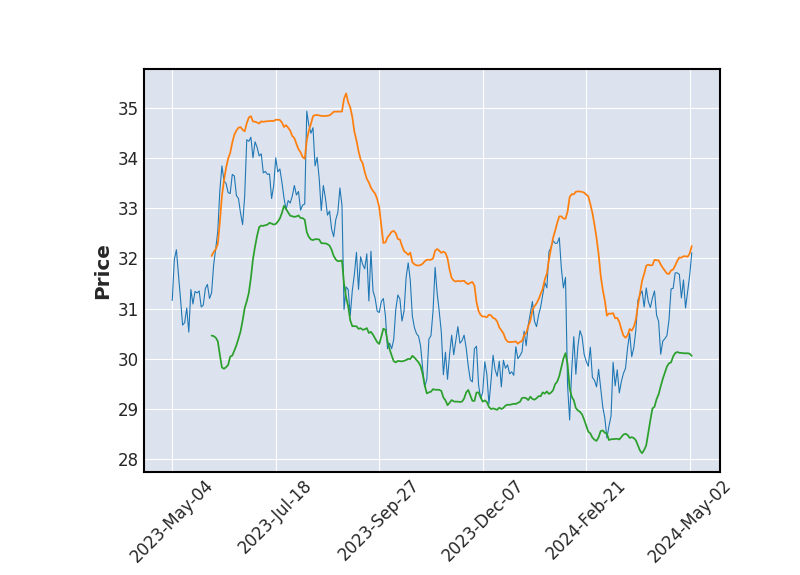 Bollinger
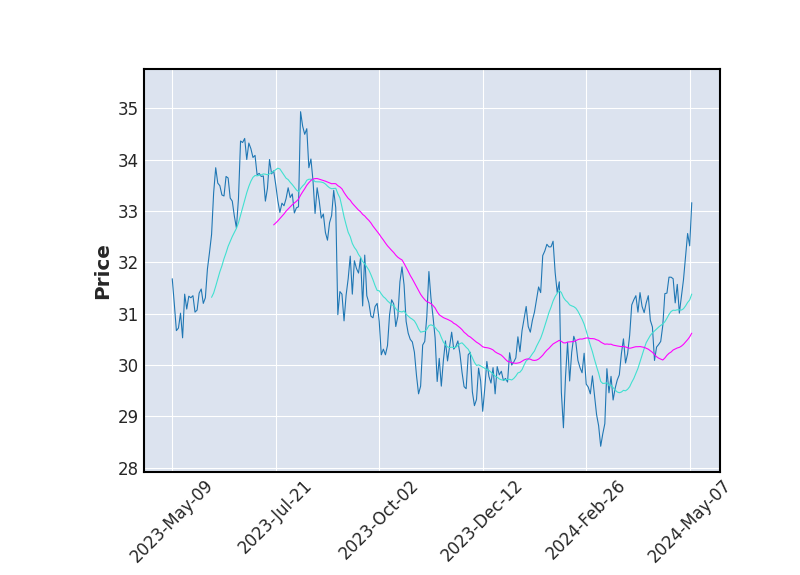 Moyenne Mobile
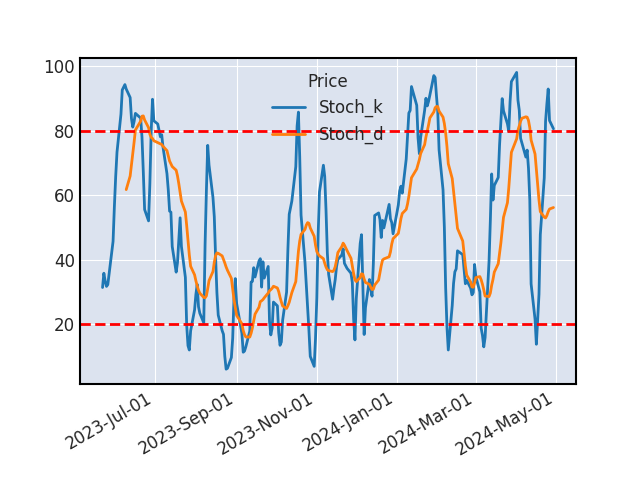 Stochastique
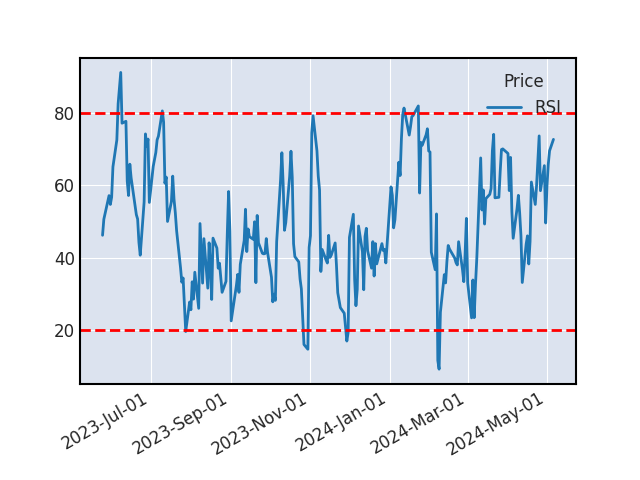 RSI
RSIL'analyse du cours ne permet pas de déterminer de tendance claire.
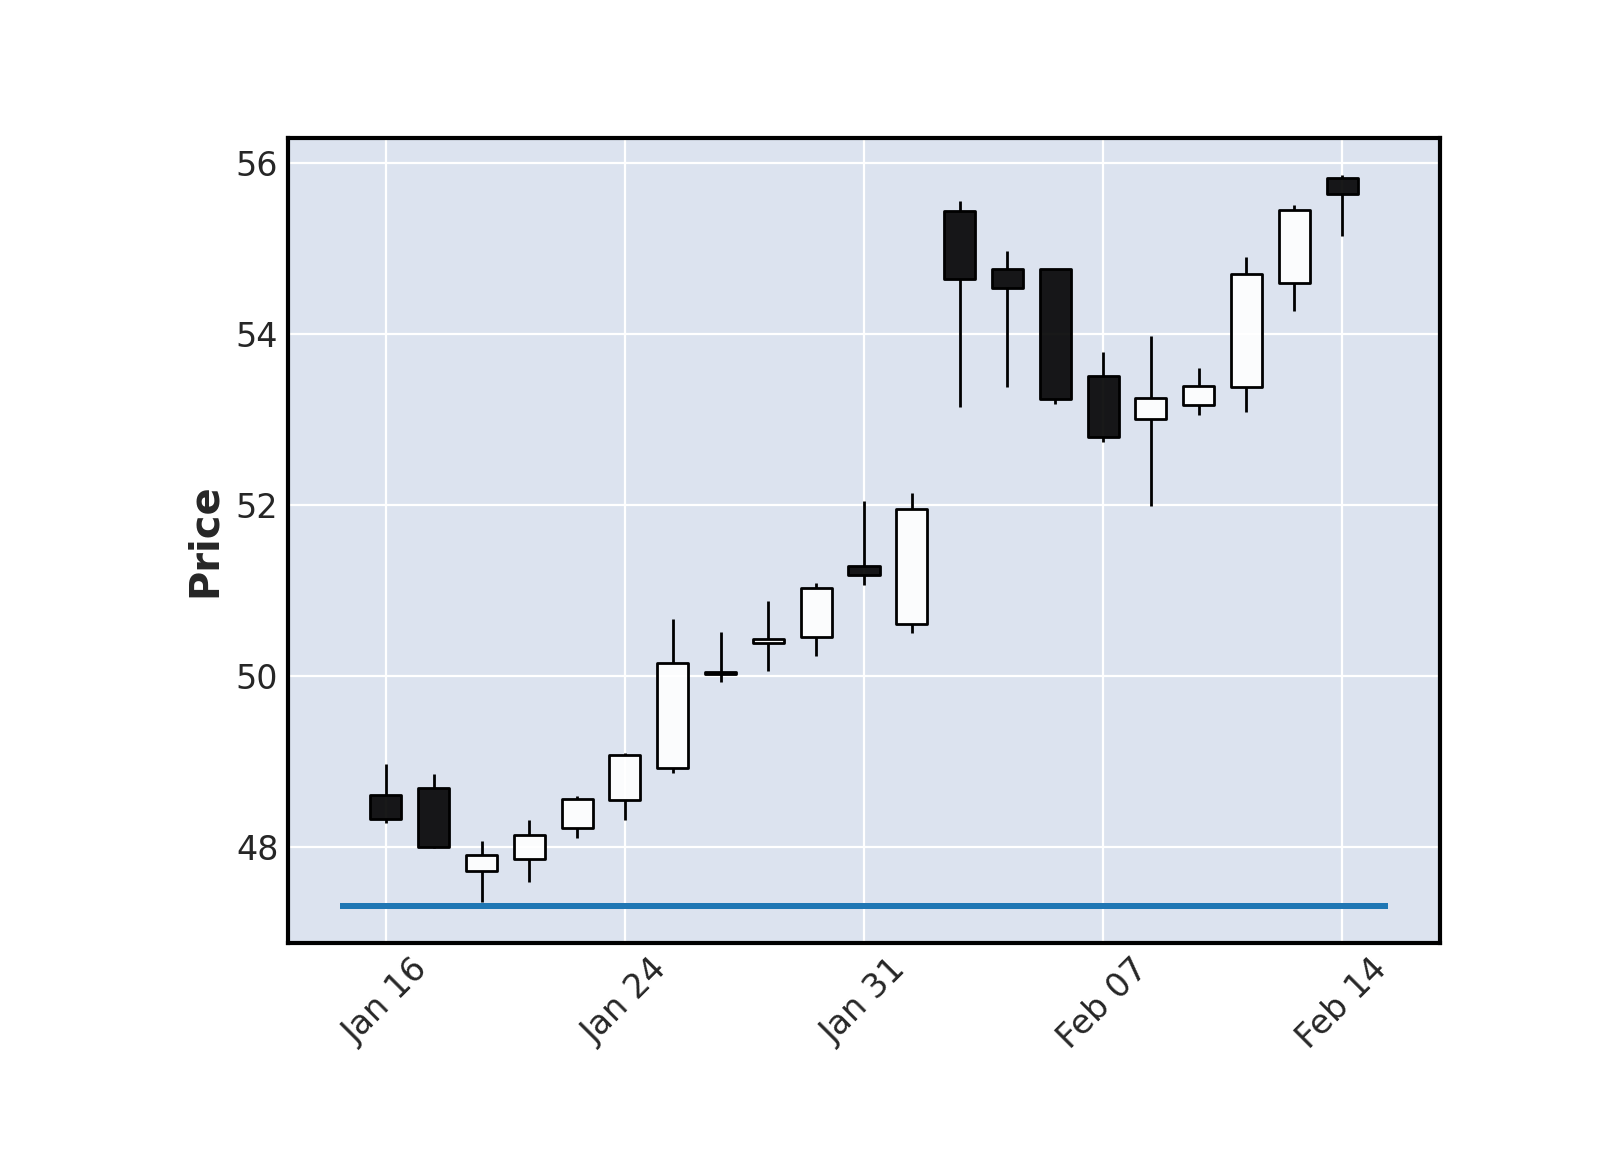
SUPPORTS ET RESISTANCES
| Support Résistance | Rebond | Ecart avec le cours |
|---|---|---|
| 56.78 | 7 | -5.11% |
| 47.32 | 5 | -20.93% |
Historique de cours - FOX A
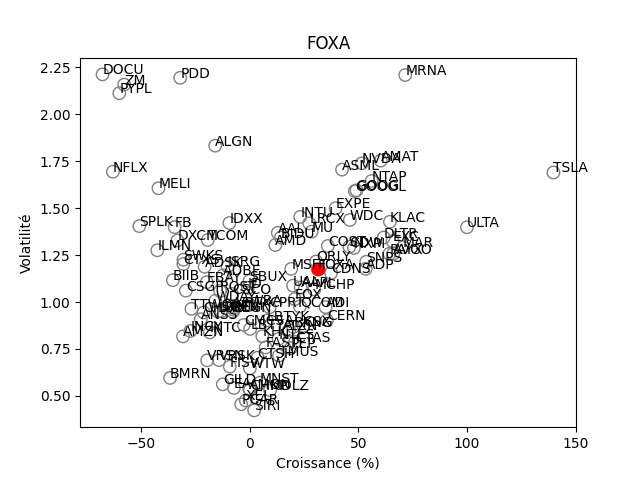
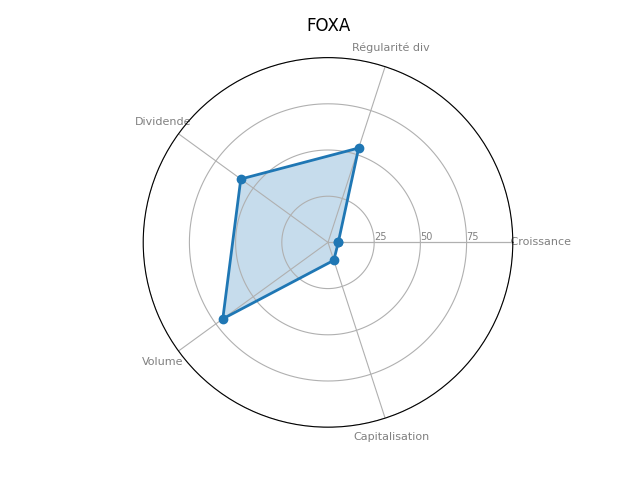
Positionnement boursier de FOX A
Version Beta