| Action | MMA | MACD_MME | Bollinger | Stochastique | RSI | Chandelier |
|---|---|---|---|---|---|---|
| FRESENIUS | RAS | RAS | RAS | Neutre | Signal ↓↓ : -24.11% | Neutre | RAS |
FRESENIUS : 48.3
| 1j | 5j | 1m | 3m | 1a |
|---|---|---|---|---|
| 1.28% | 0% | 0% | 0% | 16.55% |
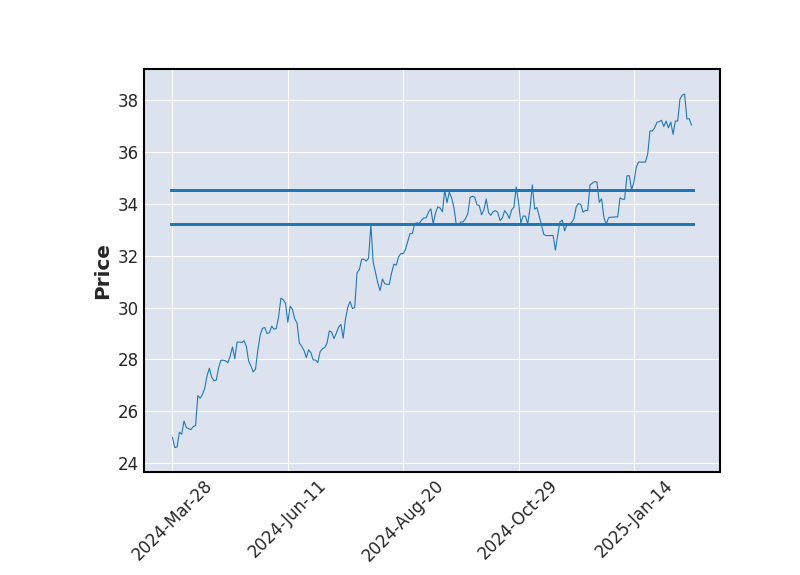
Evolution annuelle
Min : 41.14Moy : 47.38Max : 50.74
|
48.3
| Court terme | Moyen terme | Long terme |
|---|---|---|
 |  | |


Analyse Boursicot du 06/01/2026
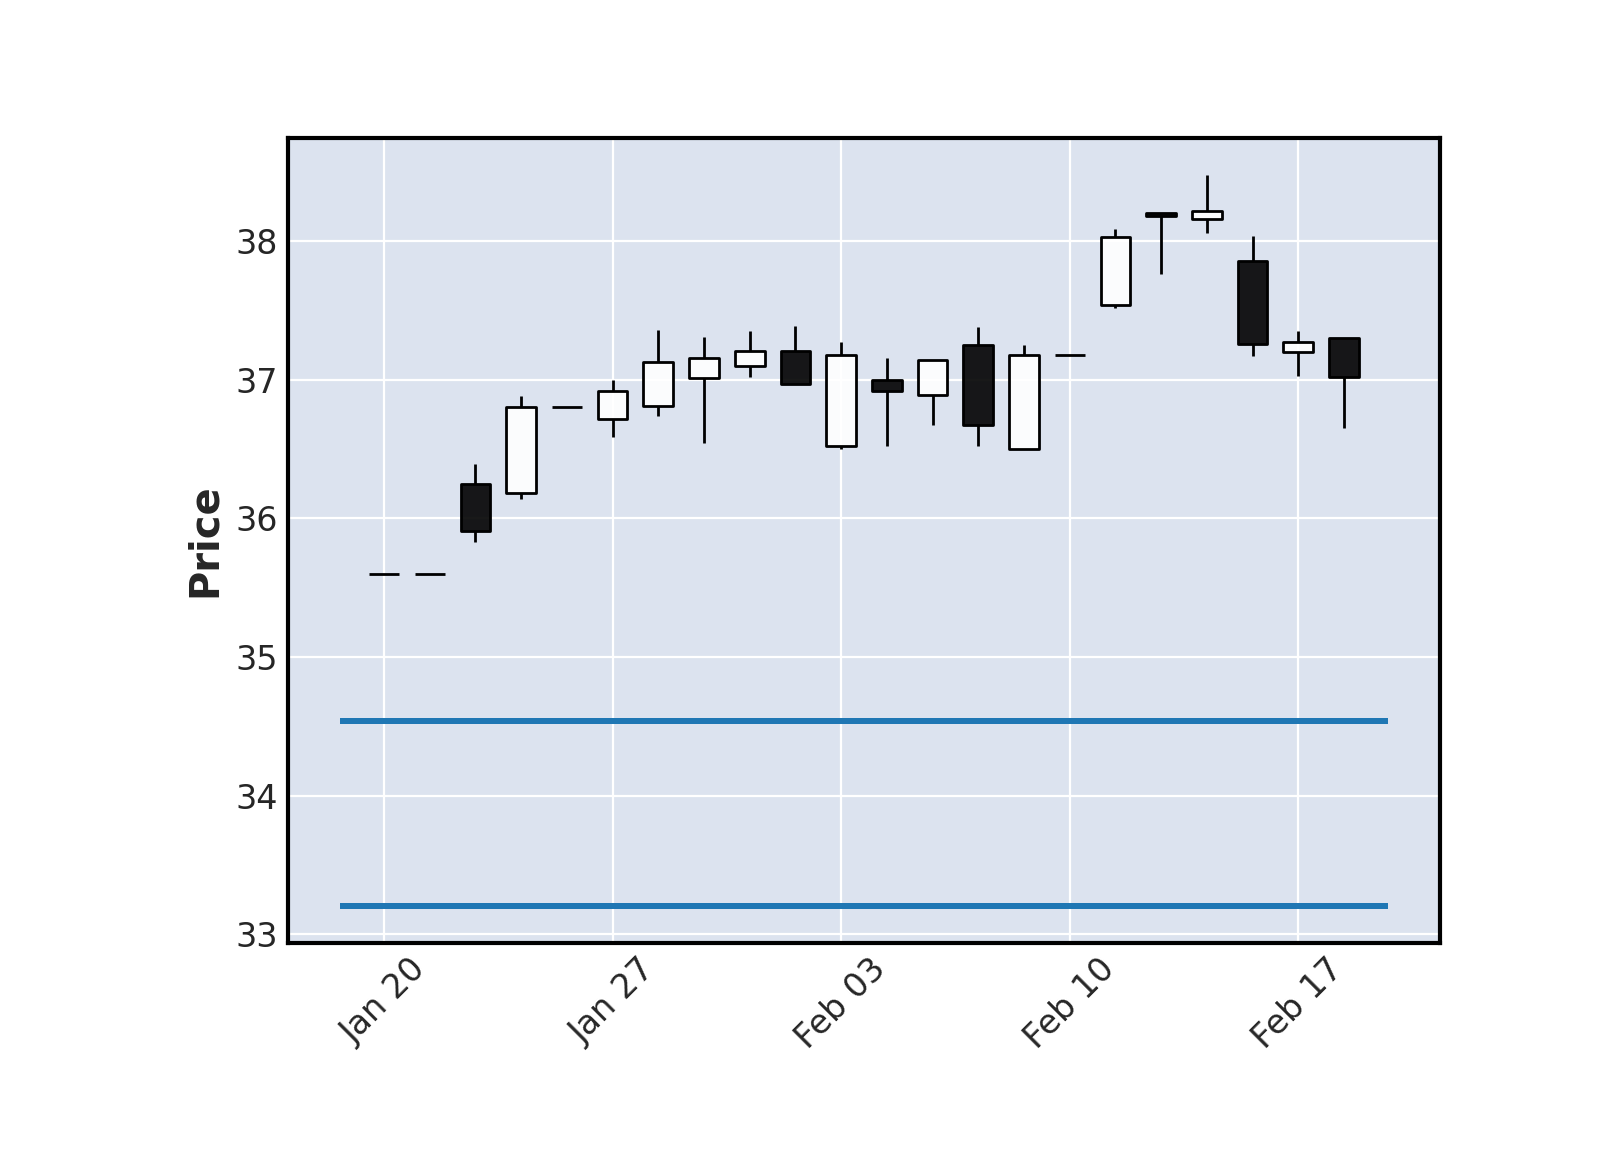
Graphique boursier
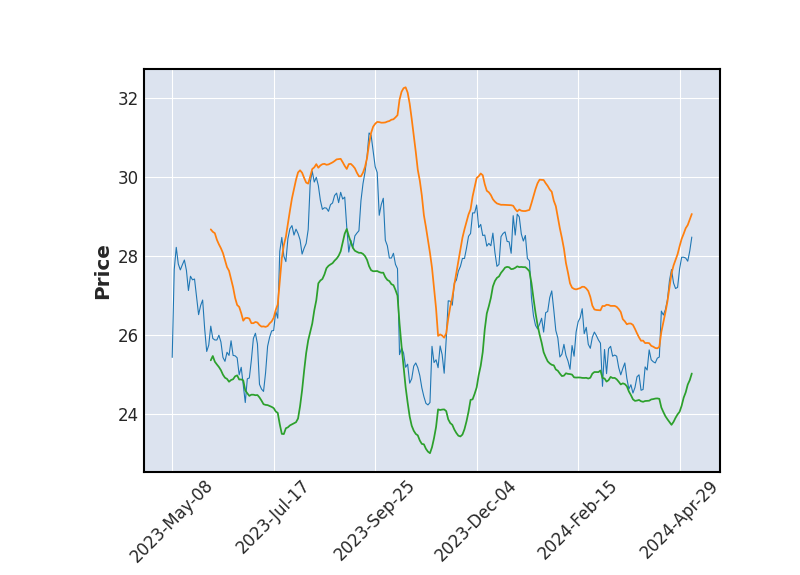 Bollinger
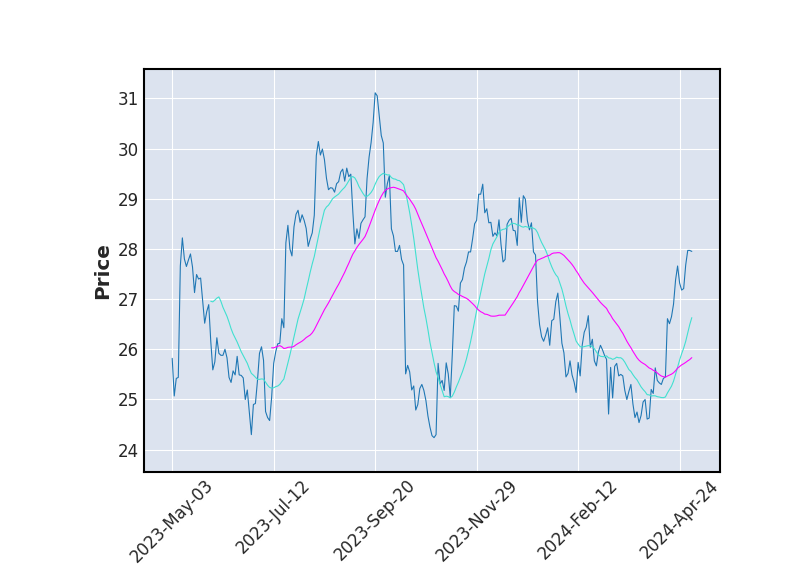 Moyenne Mobile
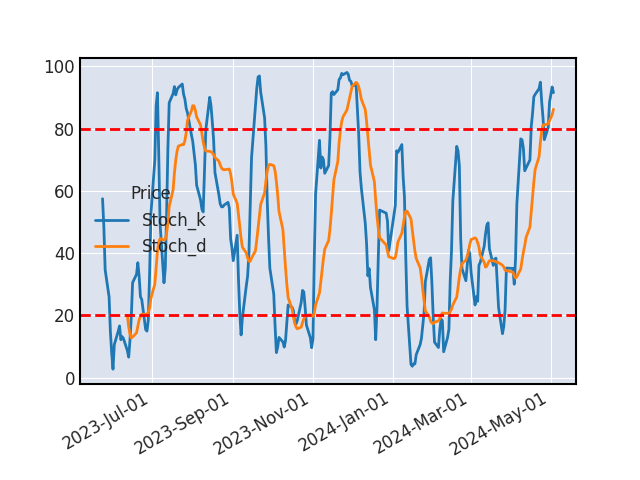 Stochastique
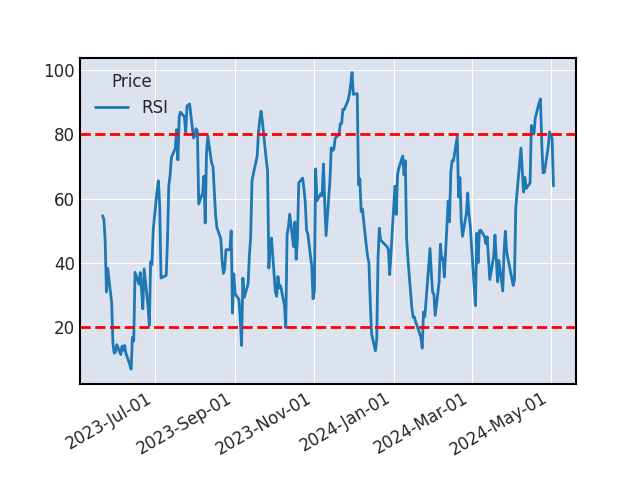 RSI
RSISTOCHASTIQUE
Une baisse devrait survenir sur le titre suite au croisement du stochastique %K et de son signal %D en cas de confirmation par un autre indicateur technique.
SUPPORTS ET RESISTANCES
| Support Résistance | Rebond | Ecart avec le cours |
|---|---|---|
| 47.54 | 6 | -1.57% |
| 46.36 | 5 | -4.02% |
| 42.42 | 3 | -12.17% |
Historique de cours - FRESENIUS
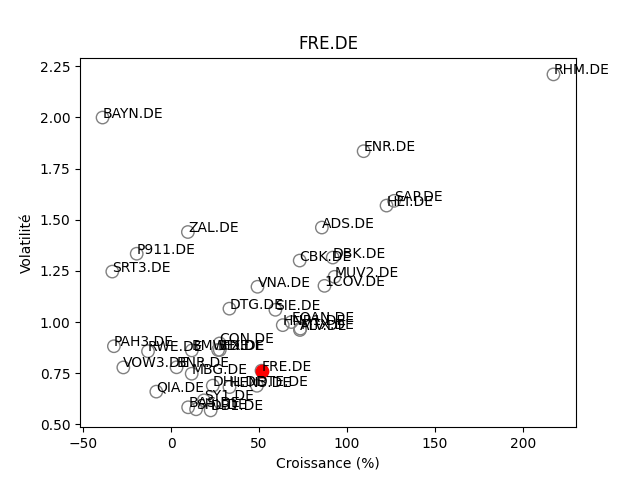
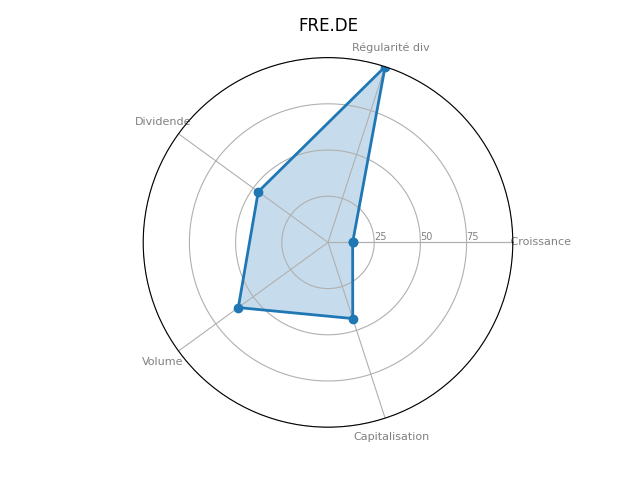
Positionnement boursier de FRESENIUS
Version Beta