| Action | MMA | MACD_MME | Bollinger | Stochastique | RSI | Chandelier |
|---|---|---|---|---|---|---|
| HENKEL PFD | RAS | RAS | RAS | Neutre | RAS | Neutre | RAS |
HENKEL PFD : 69.52
| 1j | 5j | 1m | 3m | 1a |
|---|---|---|---|---|
| -0.66% | 0% | 0% | 0% | 3.27% |
Evolution annuelle
Min : 66.6Moy : 70.82Max : 76.26
|
69.52
| Court terme | Moyen terme | Long terme |
|---|---|---|
 |  | |


Analyse Boursicot du 06/01/2026
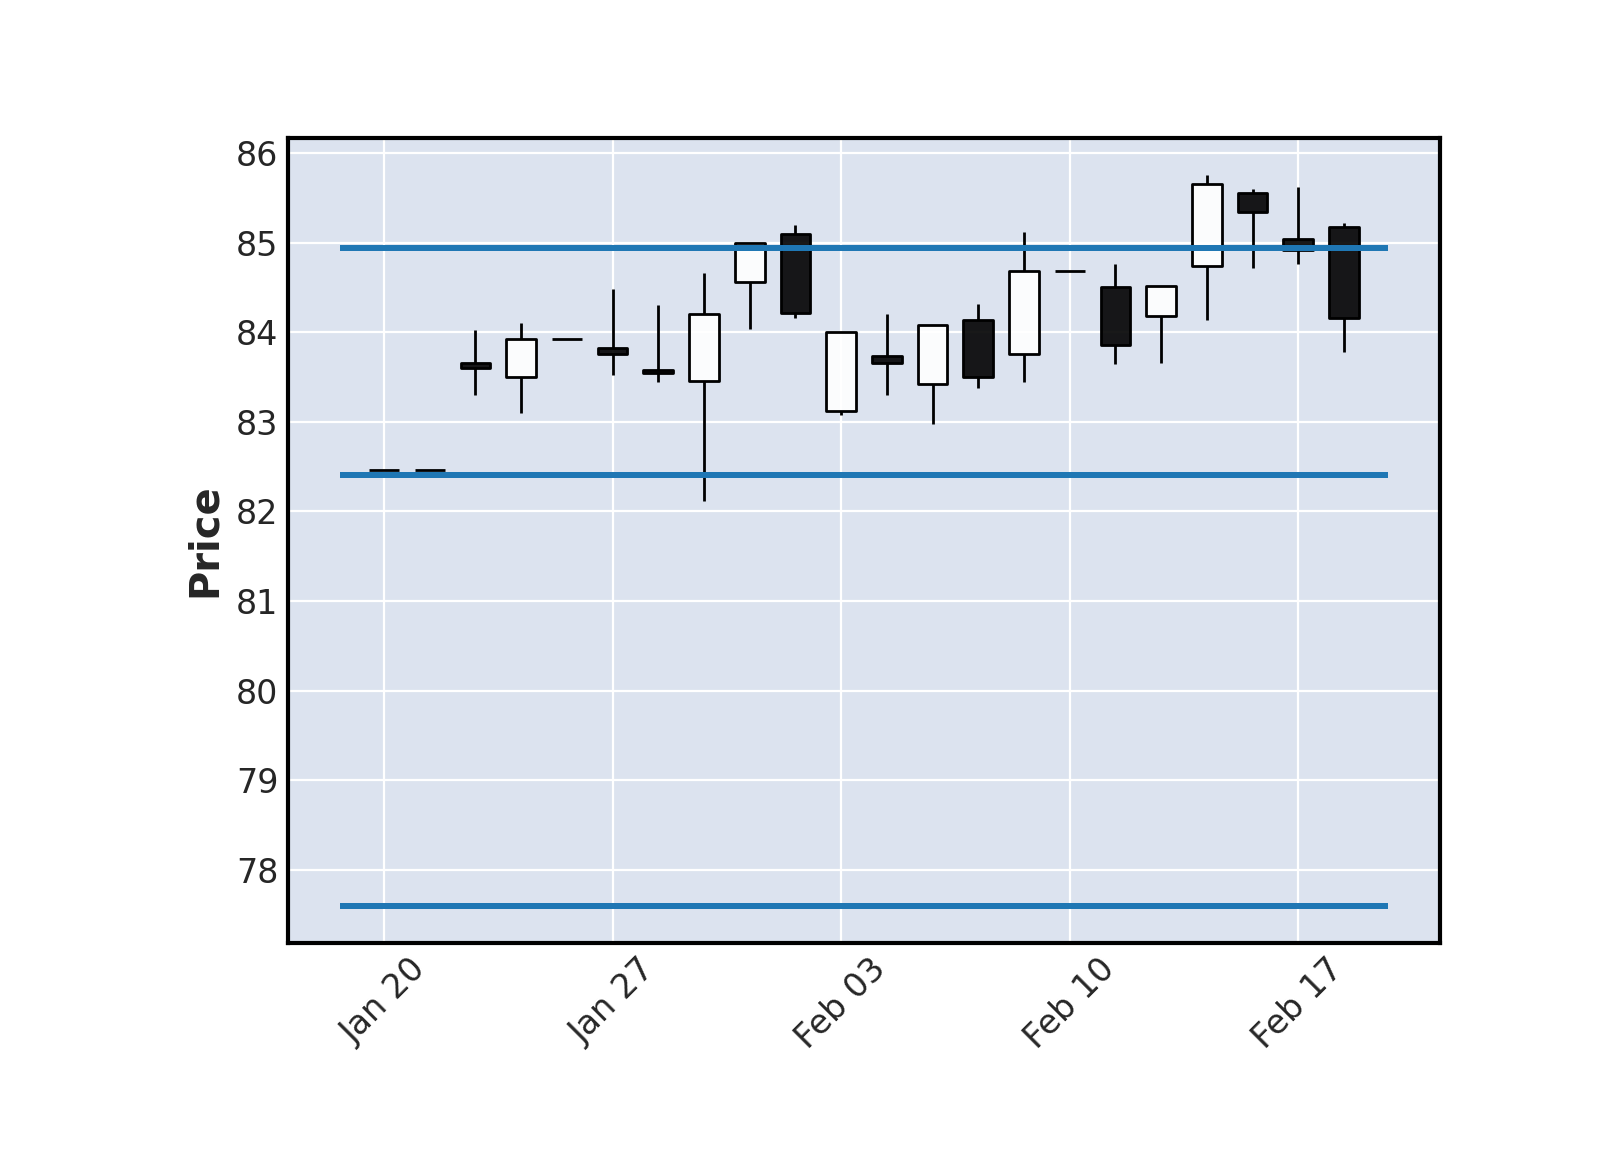
Graphique boursier
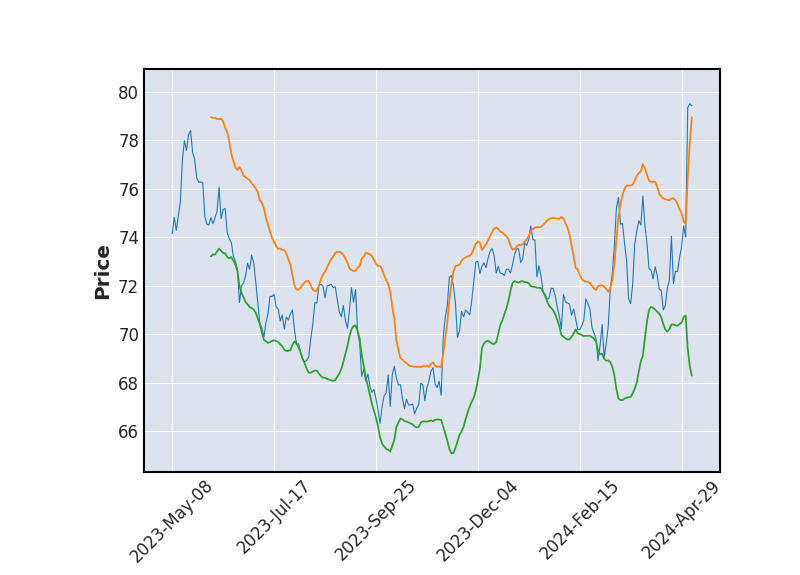 Bollinger
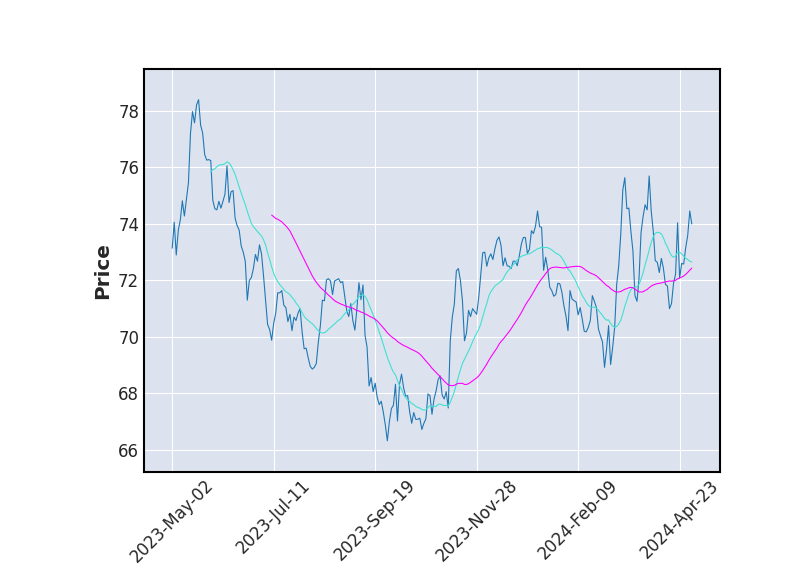 Moyenne Mobile
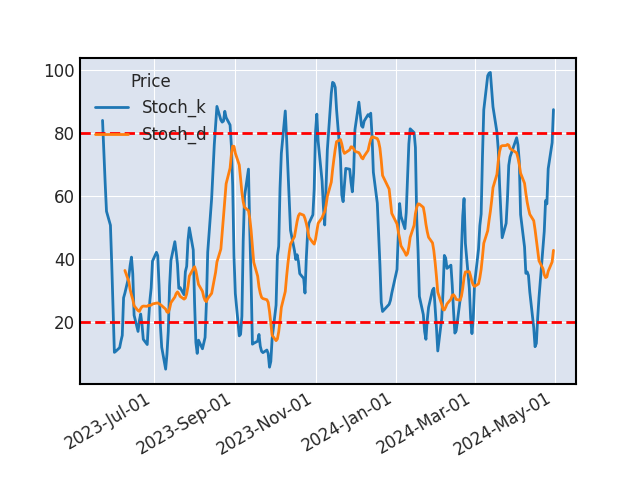 Stochastique
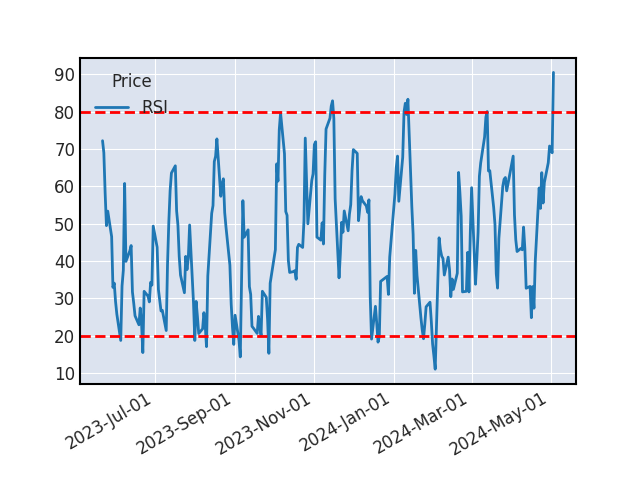 RSI
RSILe titre ne donne aucun signal d'achat ou de vente.
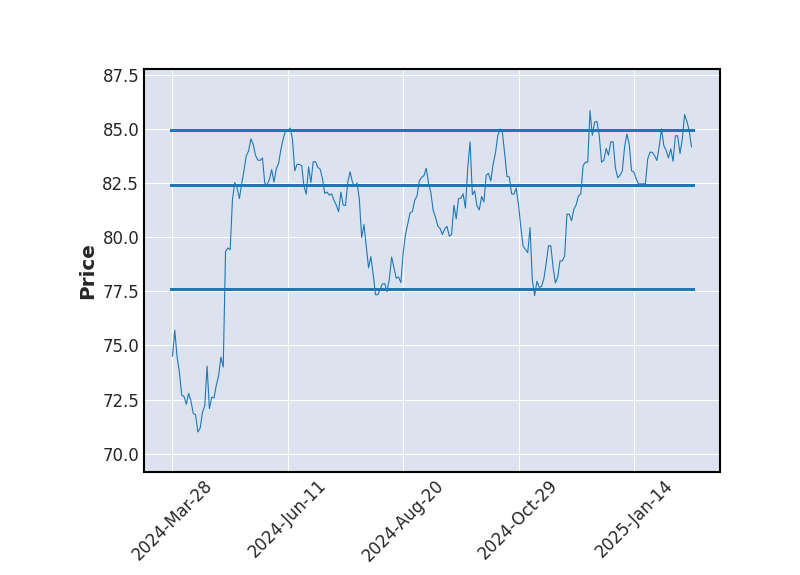
SUPPORTS ET RESISTANCES
| Support Résistance | Rebond | Ecart avec le cours |
|---|---|---|
| 72.26 | 4 | 3.94% |
| 69.49 | 13 | -0.05% |
Historique de cours - HENKEL PFD
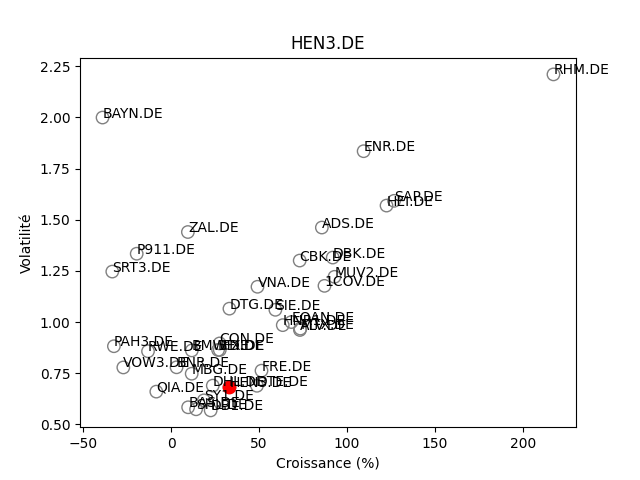
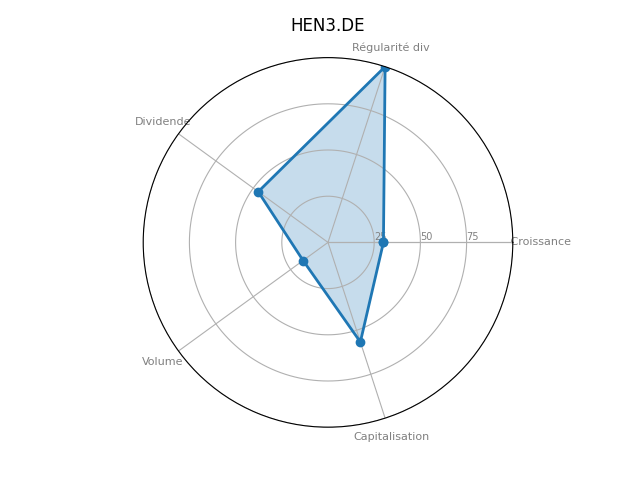
Positionnement boursier de HENKEL PFD
Version Beta