| Action | MMA | MACD_MME | Bollinger | Stochastique | RSI | Chandelier |
|---|---|---|---|---|---|---|
| ILLUMINA | RAS | RAS | RAS | Neutre | RAS | Neutre | RAS |
ILLUMINA : 103.03
| 1j | 5j | 1m | 3m | 1a |
|---|---|---|---|---|
| 2.14% | 0% | 0% | 0% | -6.23% |
Evolution annuelle
Min : 92.19Moy : 99.51Max : 111
|
103.03
| Court terme | Moyen terme | Long terme |
|---|---|---|
 |  | |


Analyse Boursicot du 18/09/2025
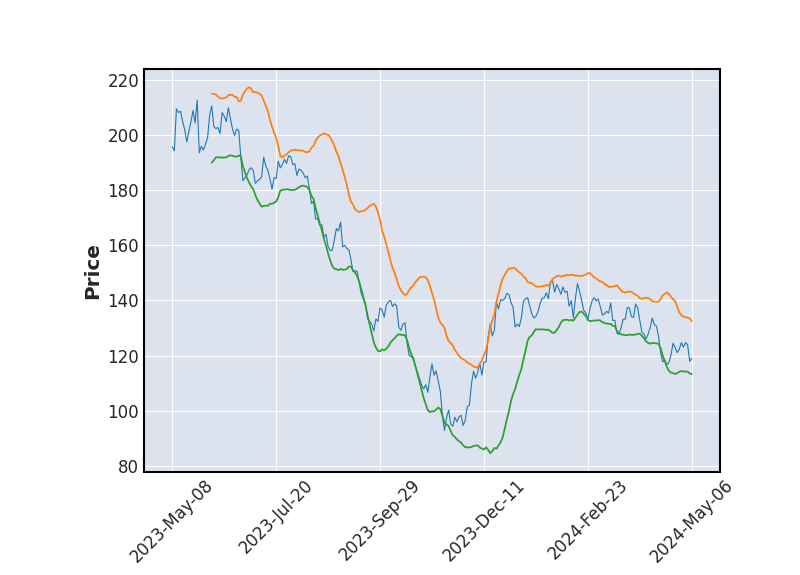
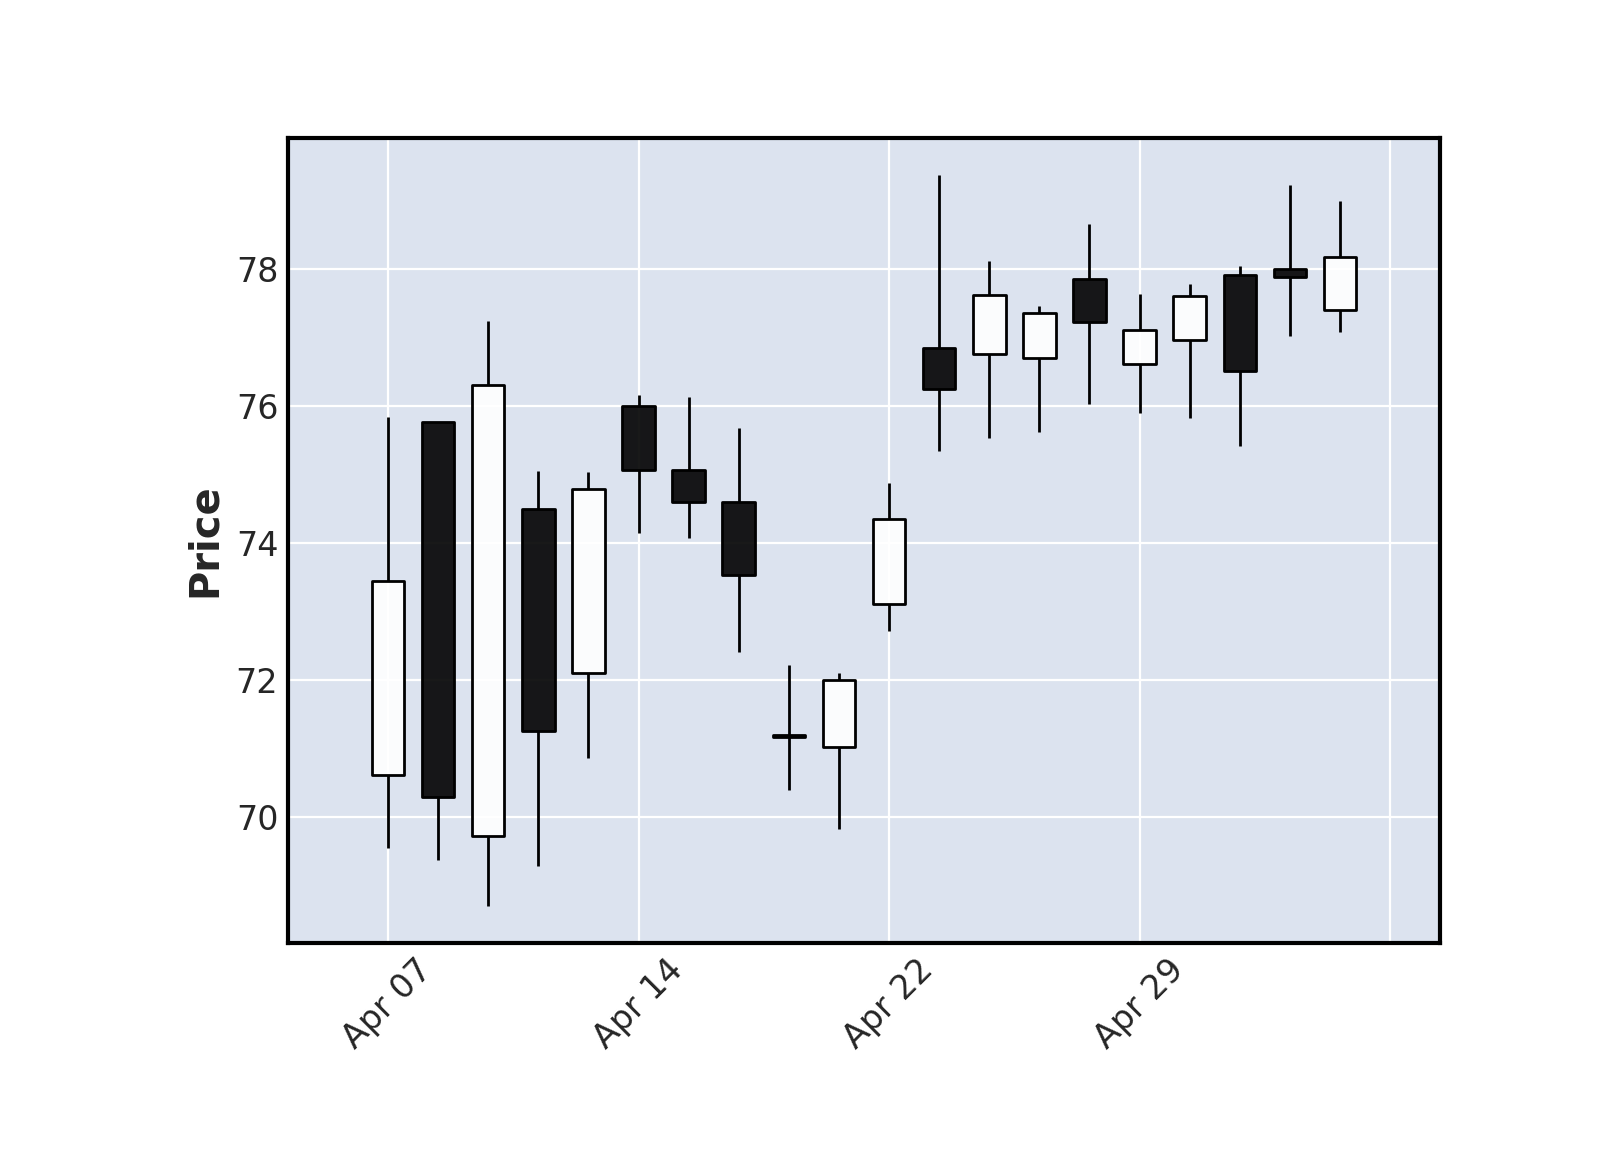
Graphique boursier
 Bollinger
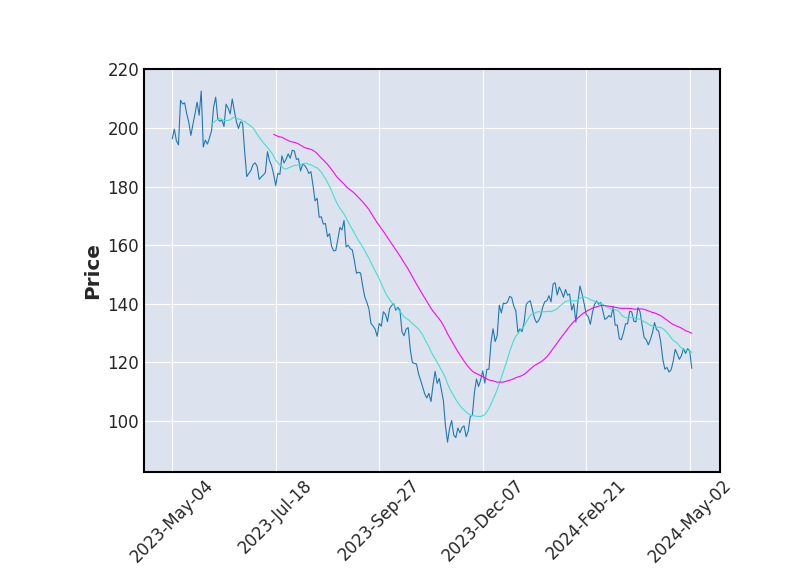 Moyenne Mobile
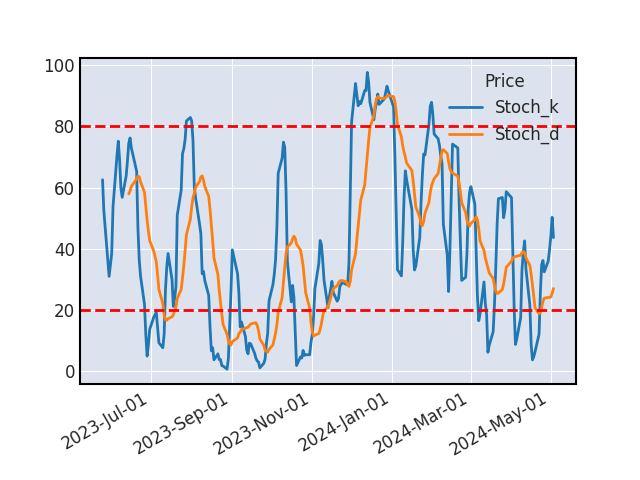 Stochastique
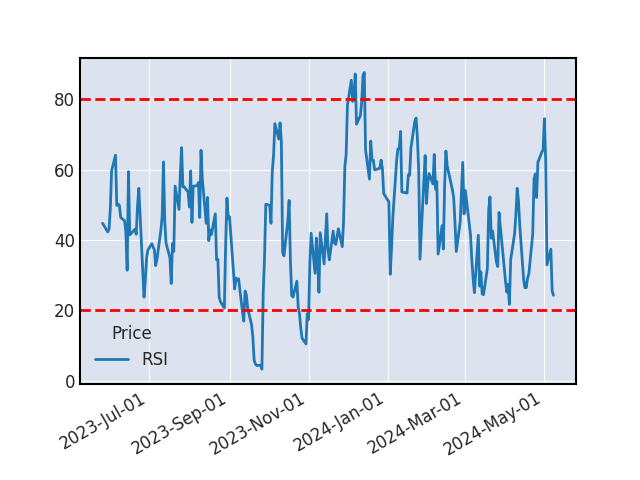 RSI
RSIAucun indicateur ne laisse présager d'une hausse ou d'une baisse à venir.
SUPPORTS ET RESISTANCES
| Support Résistance | Rebond | Ecart avec le cours |
|---|---|---|
| 84.12 | 3 | -18.35% |
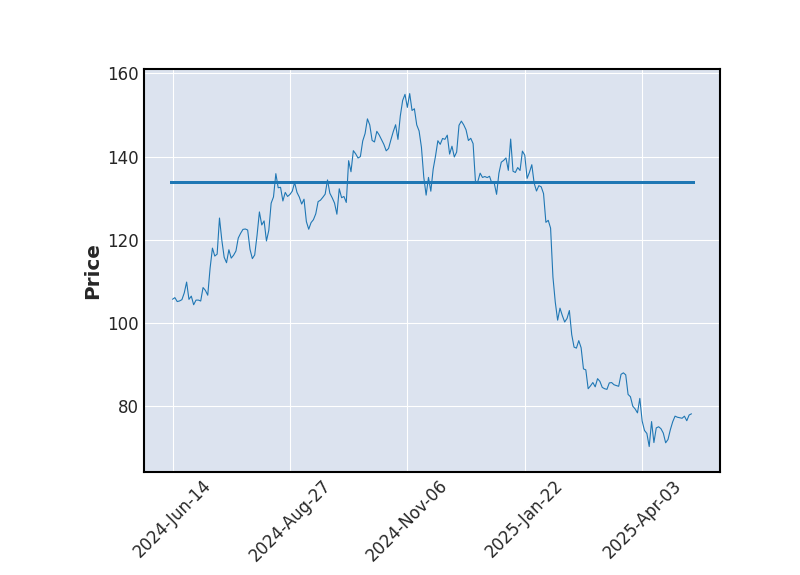
Historique de cours - ILLUMINA
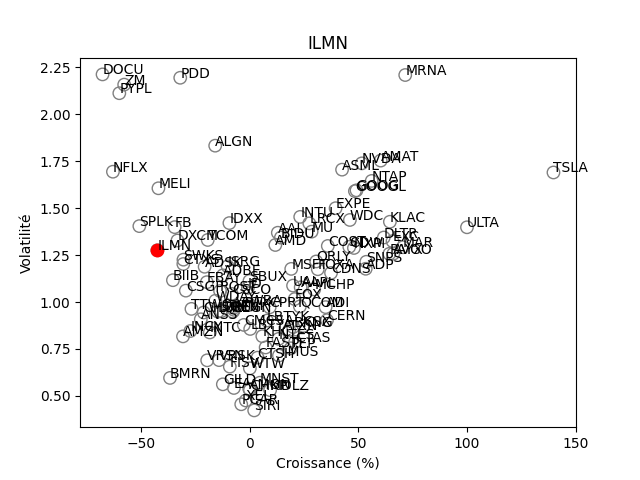
Positionnement boursier de ILLUMINA
Version Beta