| Action | MMA | MACD_MME | Bollinger | Stochastique | RSI | Chandelier |
|---|---|---|---|---|---|---|
| INTEL | RAS | RAS | RAS | Neutre | Signal ↑↑↑ : 23.43% | Neutre | RAS |
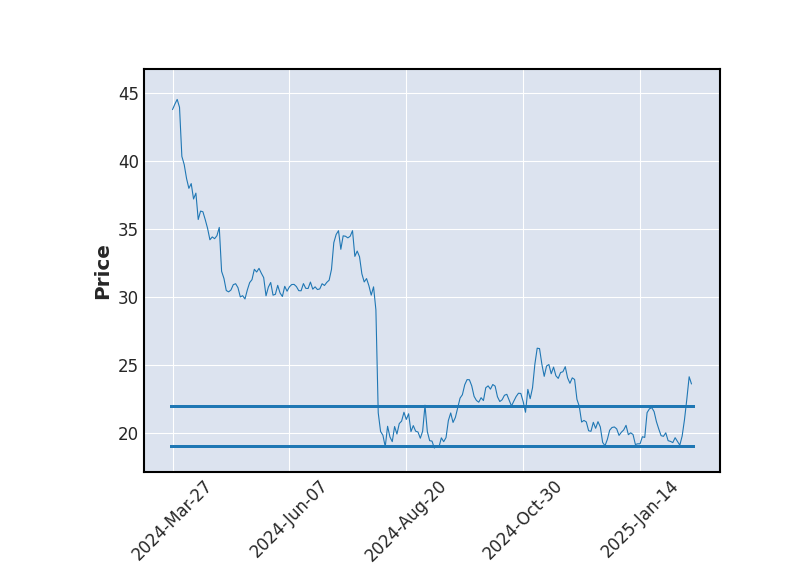
INTEL : 30.57
| 1j | 5j | 1m | 3m | 1a |
|---|---|---|---|---|
| 22.77% | 0% | 0% | 0% | 44.27% |
Evolution annuelle
Min : 18.97Moy : 23.04Max : 32.38
|
30.57
| Court terme | Moyen terme | Long terme |
|---|---|---|
 | | |


Analyse Boursicot du 18/09/2025
Graphique boursier
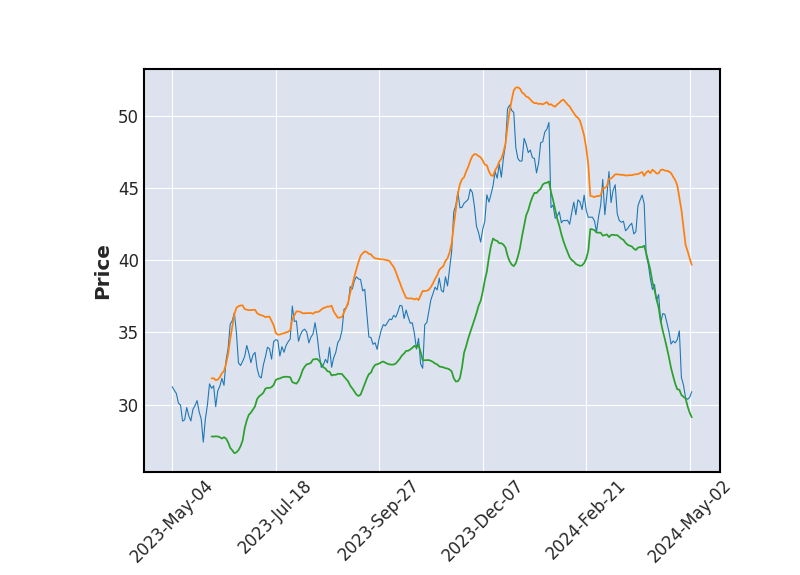 Bollinger
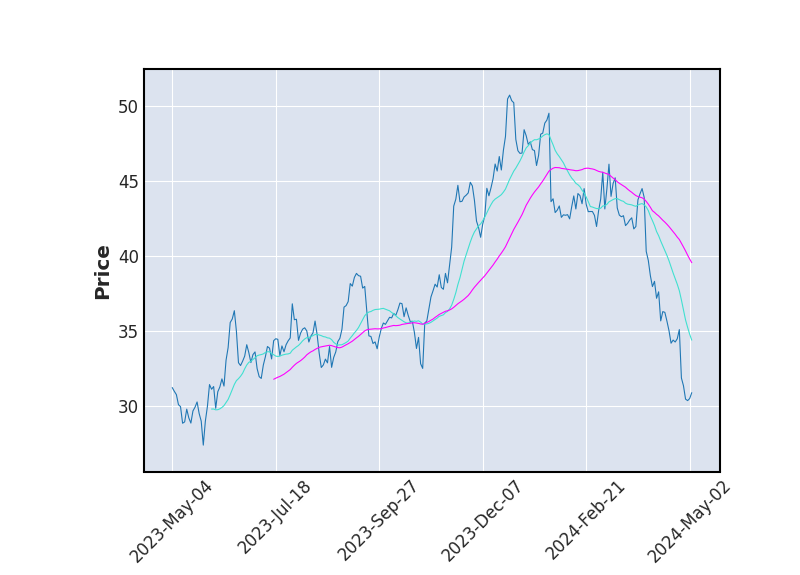 Moyenne Mobile
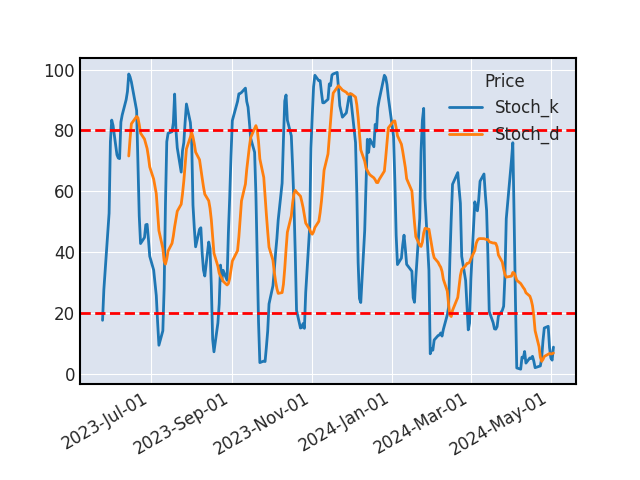 Stochastique
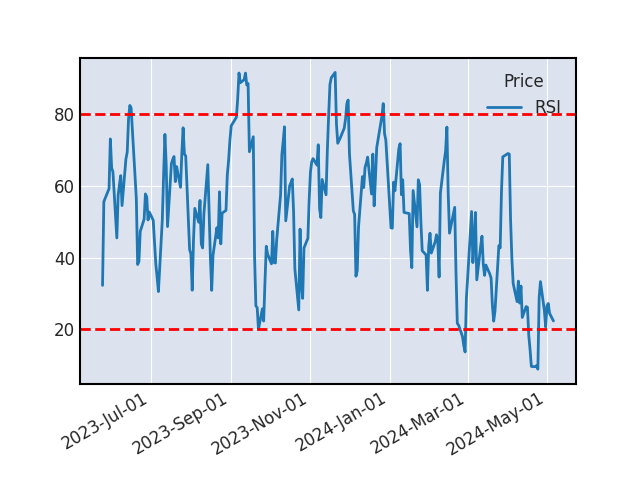 RSI
RSISTOCHASTIQUE
Une hausse devrait survenir sur le titre suite au croisement du stochastique %K et de son signal %D en cas de confirmation par un autre indicateur technique.
VOLUME
Nous constatons plus de 50% d'échange de plus que d'habitude sur le titre.
SUPPORTS ET RESISTANCES
| Support Résistance | Rebond | Ecart avec le cours |
|---|---|---|
| 23.87 | 3 | -21.92% |
| 23.5 | 3 | -23.14% |
| 21.95 | 5 | -28.2% |
| 19.1 | 4 | -37.51% |
Historique de cours - INTEL

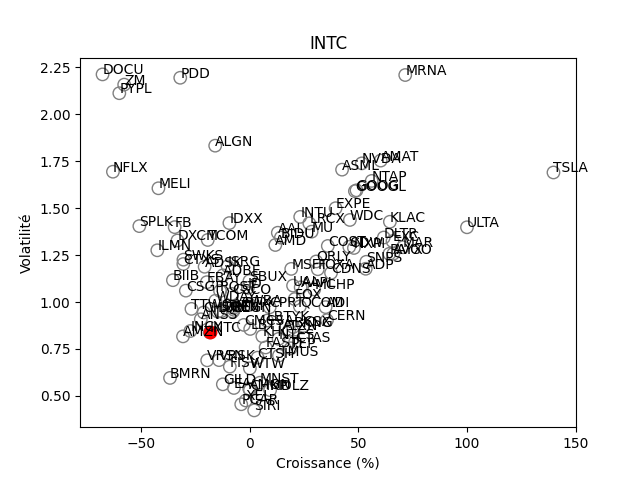
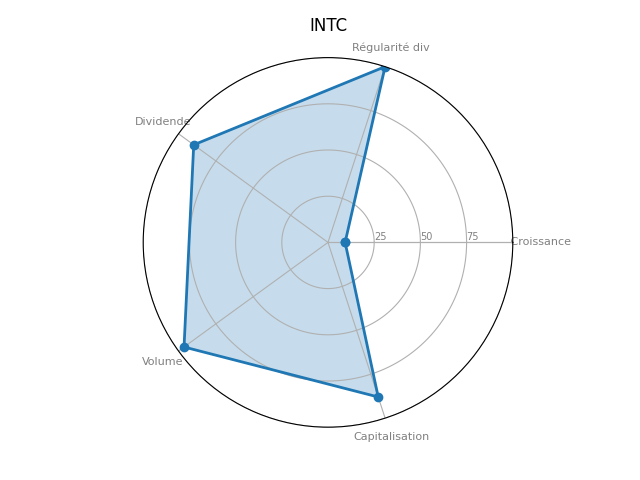
Positionnement boursier de INTEL
Version Beta