| Action | MMA | MACD_MME | Bollinger | Stochastique | RSI | Chandelier |
|---|---|---|---|---|---|---|
| LIBERTY GLOBAL A | RAS | RAS | RAS (Rétr.) | Neutre | RAS | Neutre | RAS |
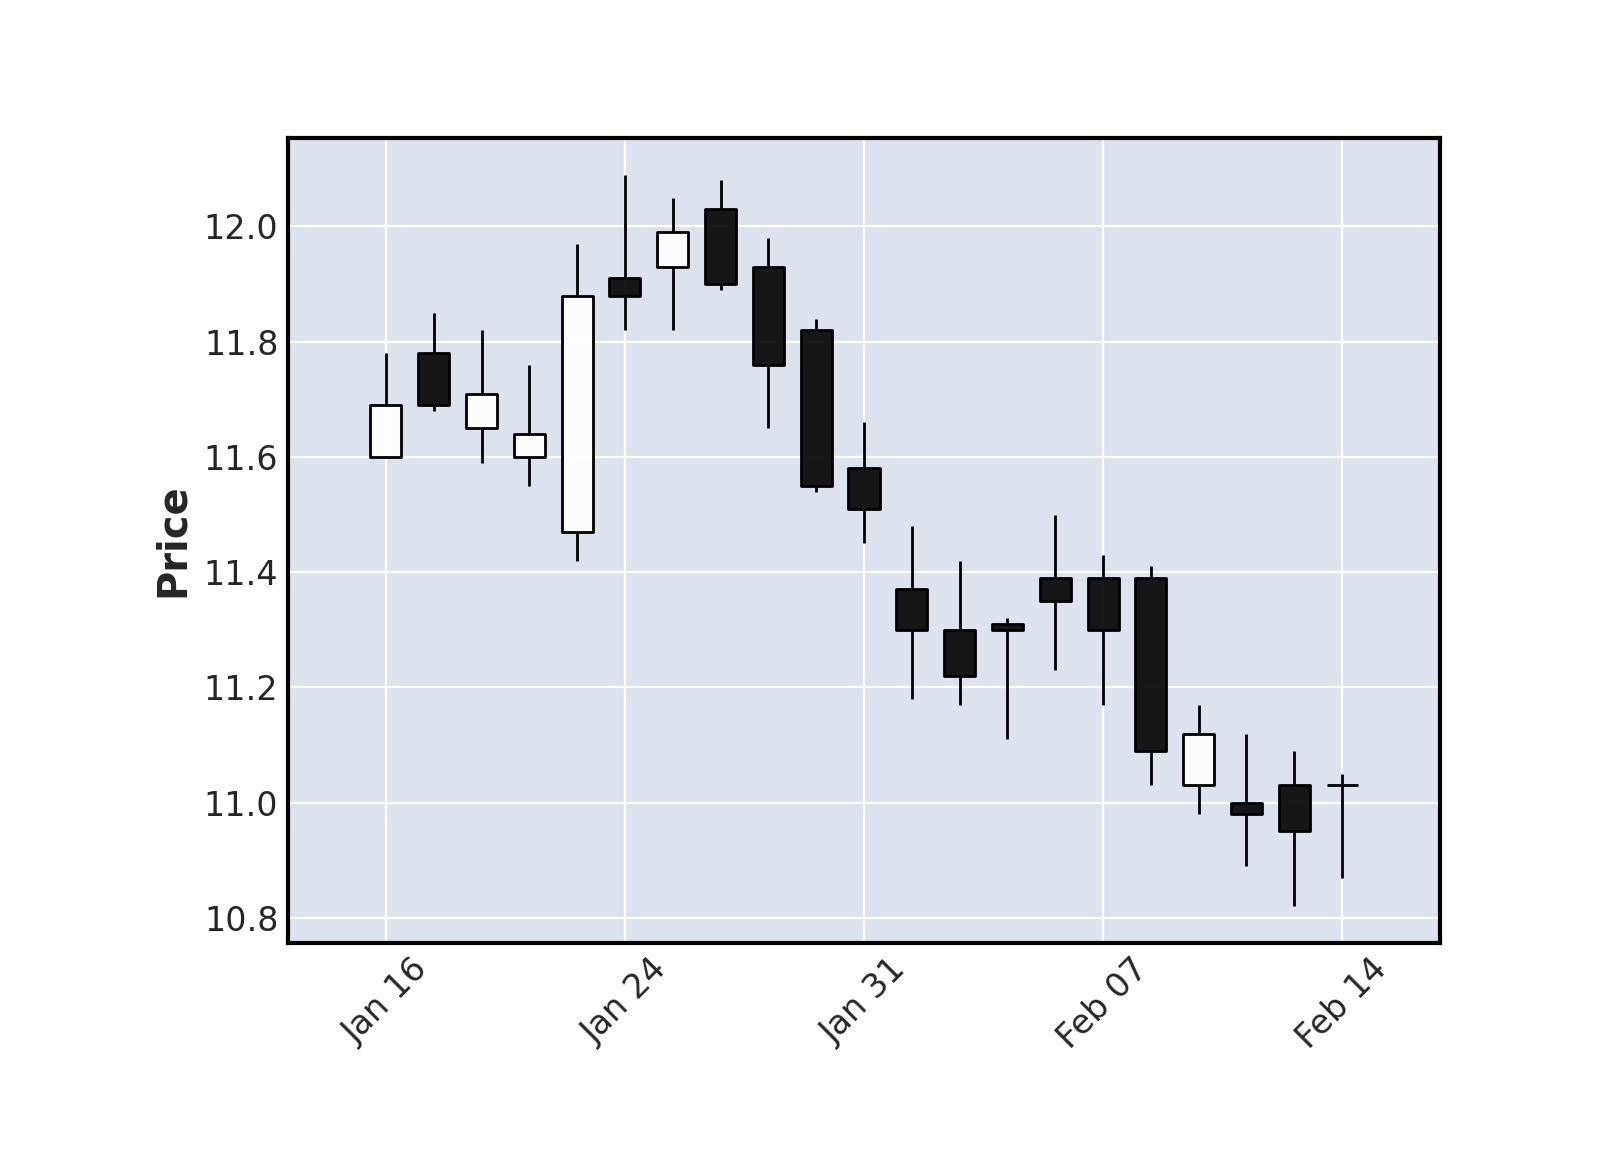
LIBERTY GLOBAL A : 11.94
| 1j | 5j | 1m | 3m | 1a |
|---|---|---|---|---|
| 1.36% | 0% | 0% | 0% | 17.75% |
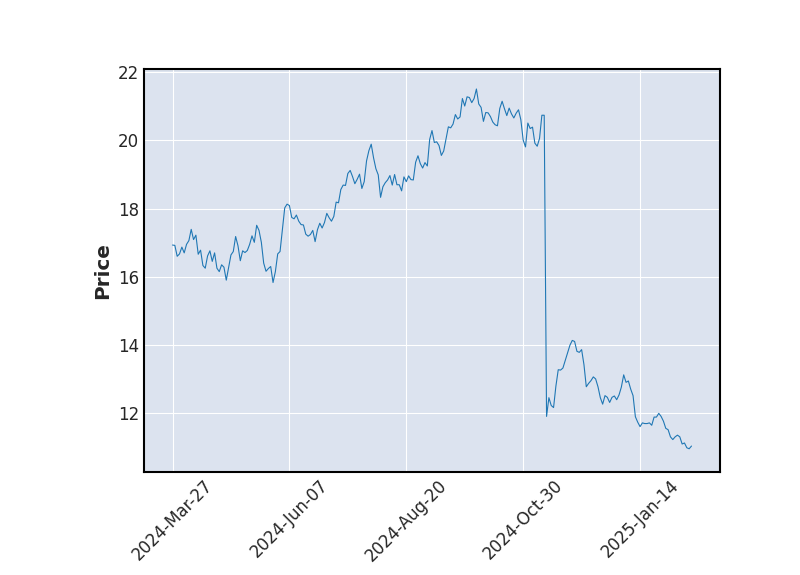
Evolution annuelle
Min : 9.62Moy : 10.92Max : 12.09
|
11.94
| Court terme | Moyen terme | Long terme |
|---|---|---|
 | |  |


Analyse Boursicot du 18/09/2025
Graphique boursier
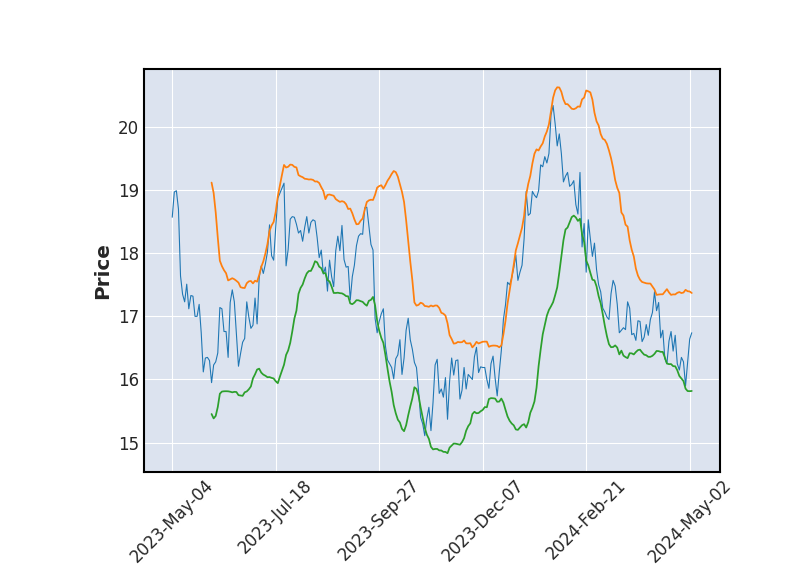 Bollinger
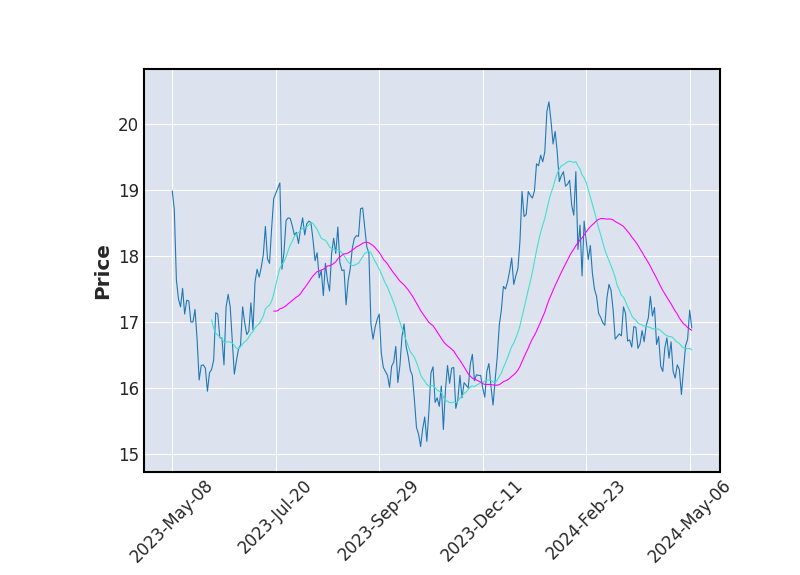 Moyenne Mobile
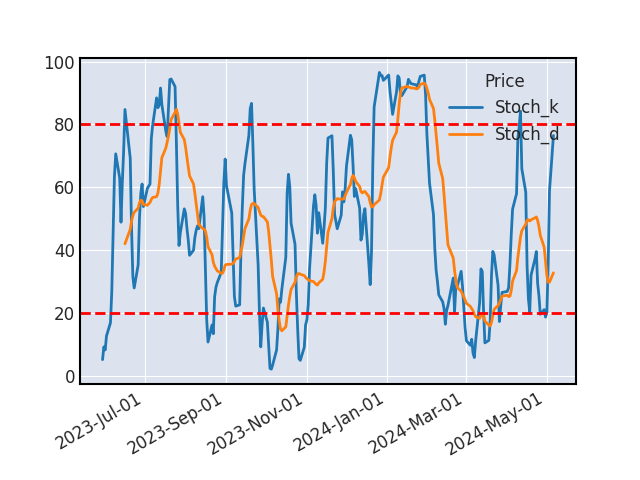 Stochastique
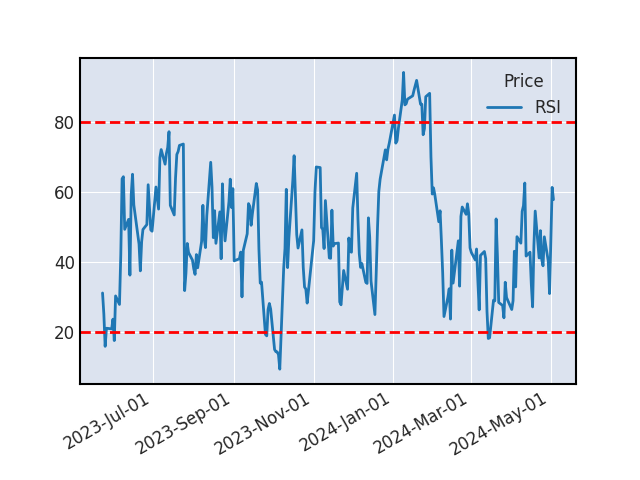 RSI
RSI
L'analyse technique n'a pas permis d'identifier d'évolution à la hausse ou à la baisse.
SUPPORTS ET RESISTANCES
| Support Résistance | Rebond | Ecart avec le cours |
|---|---|---|
| 11.92 | 4 | -0.14% |
| 11.6 | 4 | -2.85% |
| 11.31 | 3 | -5.28% |
| 10.2 | 4 | -14.55% |
| 10.01 | 3 | -16.21% |
| 9.72 | 3 | -18.55% |
Historique de cours - LIBERTY GLOBAL A
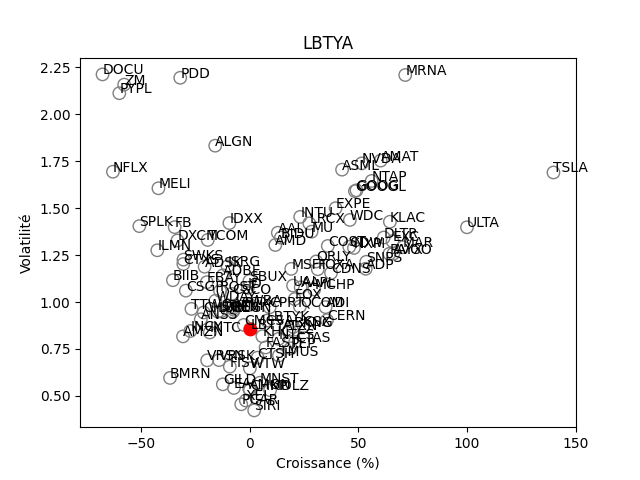
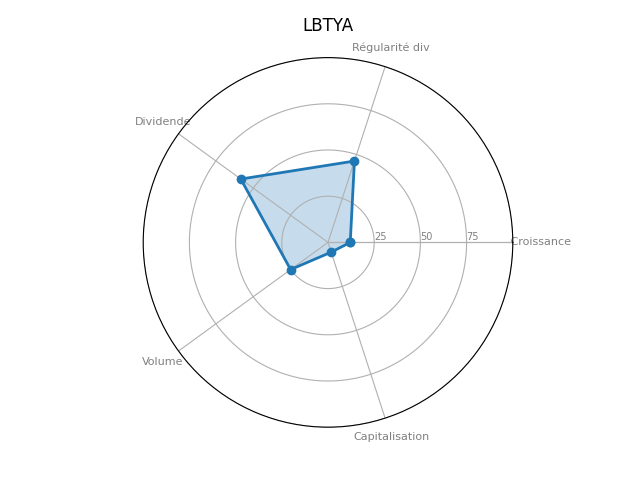
Positionnement boursier de LIBERTY GLOBAL A
Version Beta