| Action | MMA | MACD_MME | Bollinger | Stochastique | RSI | Chandelier |
|---|---|---|---|---|---|---|
| MTU AERO ENGINE | RAS | RAS | RAS | Neutre | Signal ↑↑↑ : 23.59% | Neutre | RAS |
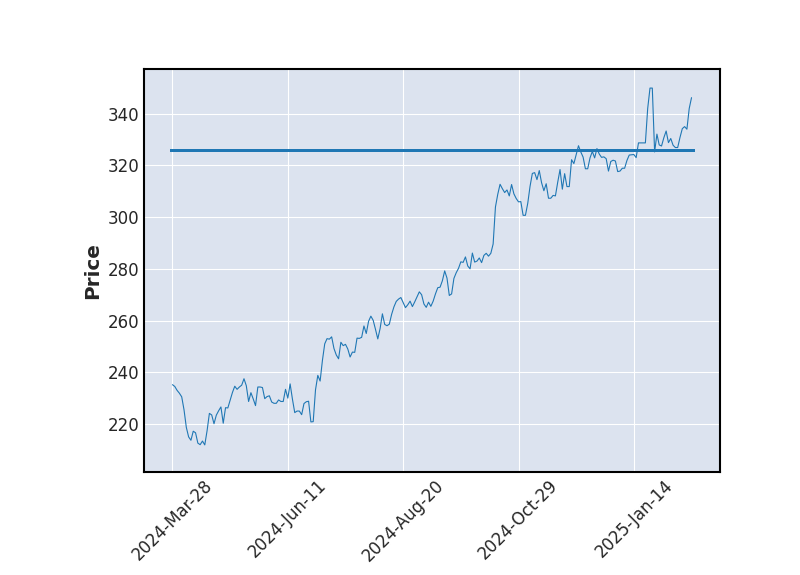
MTU AERO ENGINE : 383.4
| 1j | 5j | 1m | 3m | 1a |
|---|---|---|---|---|
| 2.76% | 0% | 0% | 0% | 3.51% |
Evolution annuelle
Min : 338Moy : 370.4Max : 399.5
|
383.4
| Court terme | Moyen terme | Long terme |
|---|---|---|
 |  | |


Analyse Boursicot du 06/01/2026
Graphique boursier
 Bollinger
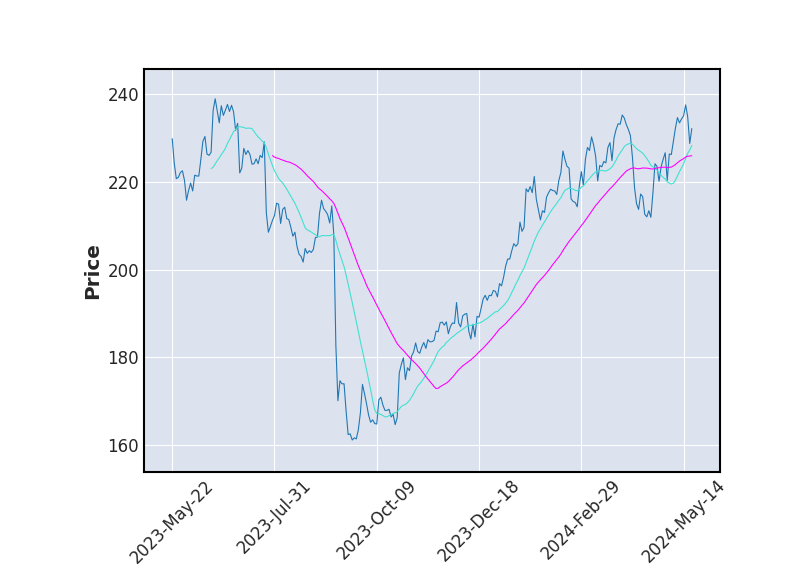 Moyenne Mobile
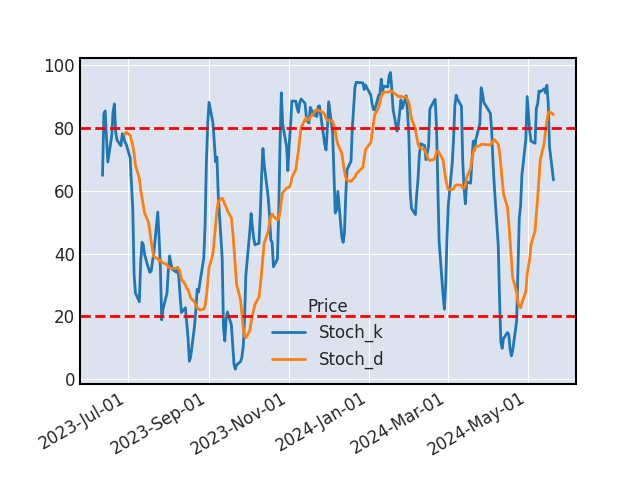 Stochastique
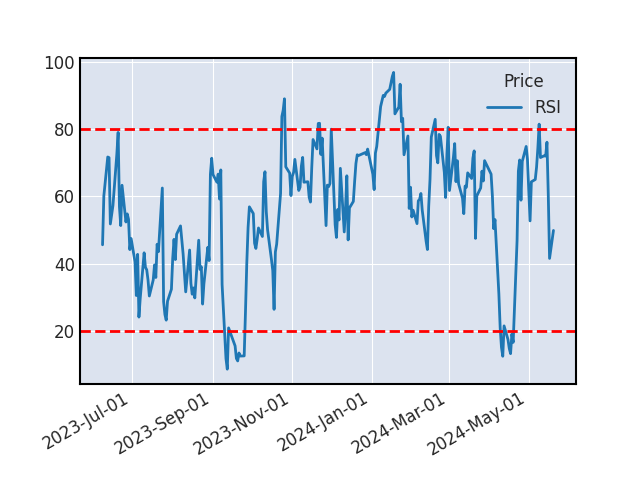 RSI
RSISTOCHASTIQUE
Le stochastique et son signal viennent de se croiser, indiquant une hausse à venir sur le titre (il est recommandé de valider ce signal haussier par un indicateur complémentaire).
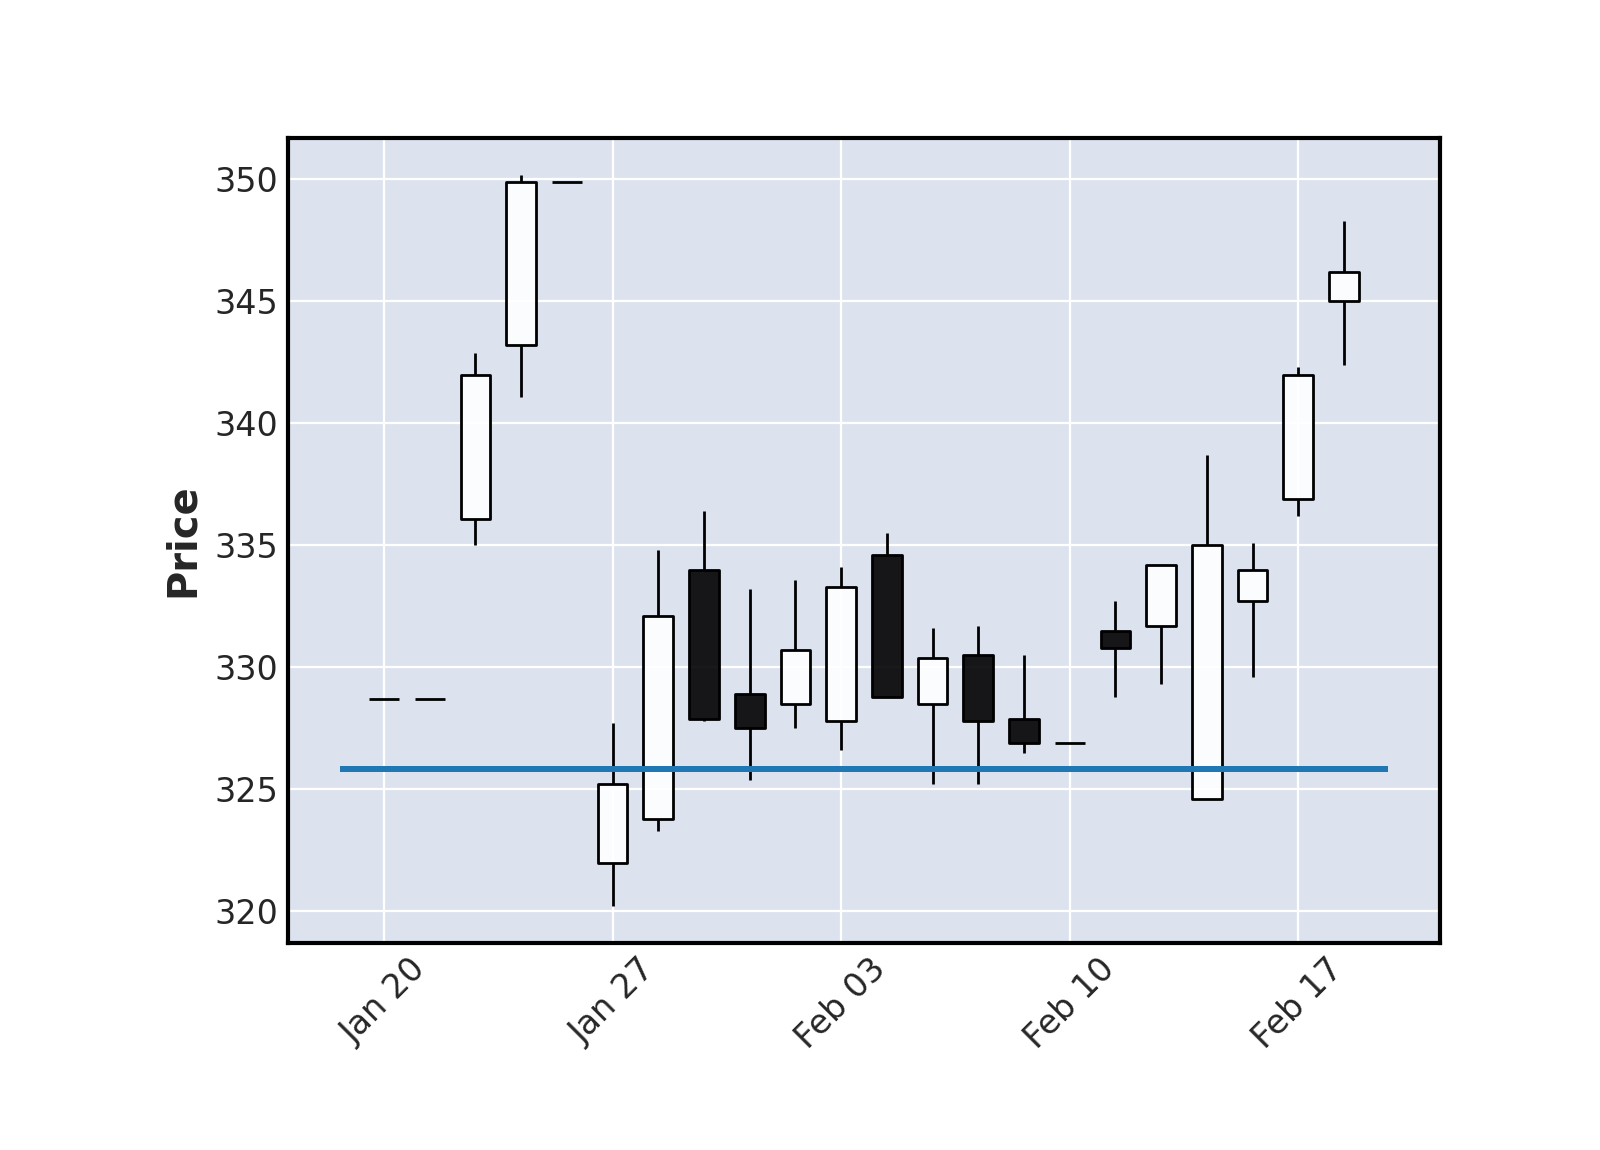
SUPPORTS ET RESISTANCES
| Support Résistance | Rebond | Ecart avec le cours |
|---|---|---|
| 396.9 | 2 | 3.52% |
| 386.7 | 4 | 0.86% |
| 355.85 | 7 | -7.19% |
Historique de cours - MTU AERO ENGINE
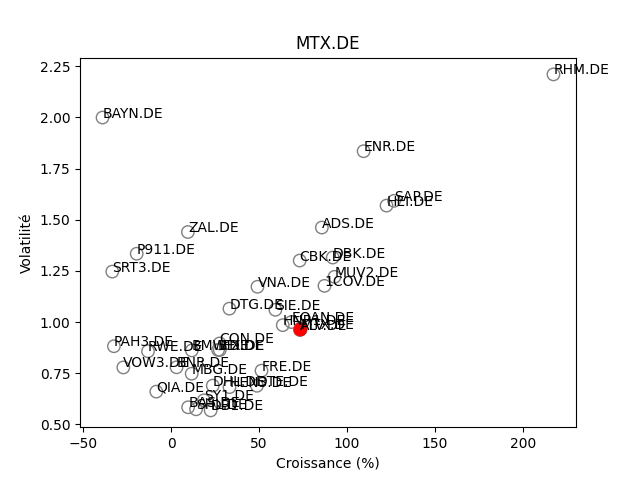
Positionnement boursier de MTU AERO ENGINE

Version Beta