| Action | MMA | MACD_MME | Bollinger | Stochastique | RSI | Chandelier |
|---|---|---|---|---|---|---|
| O REILLY AUTOMOTIVE | RAS | RAS | RAS | Neutre | Signal ↓↓↓ : -46.24% | Neutre | RAS |
O REILLY AUTOMOTIVE : 103.69
| 1j | 5j | 1m | 3m | 1a |
|---|---|---|---|---|
| -0.82% | 0% | 0% | 0% | 11.35% |
Evolution annuelle
Min : 90.38Moy : 101.32Max : 108.42
|
103.69
| Court terme | Moyen terme | Long terme |
|---|---|---|
 | | |


Analyse Boursicot du 18/09/2025
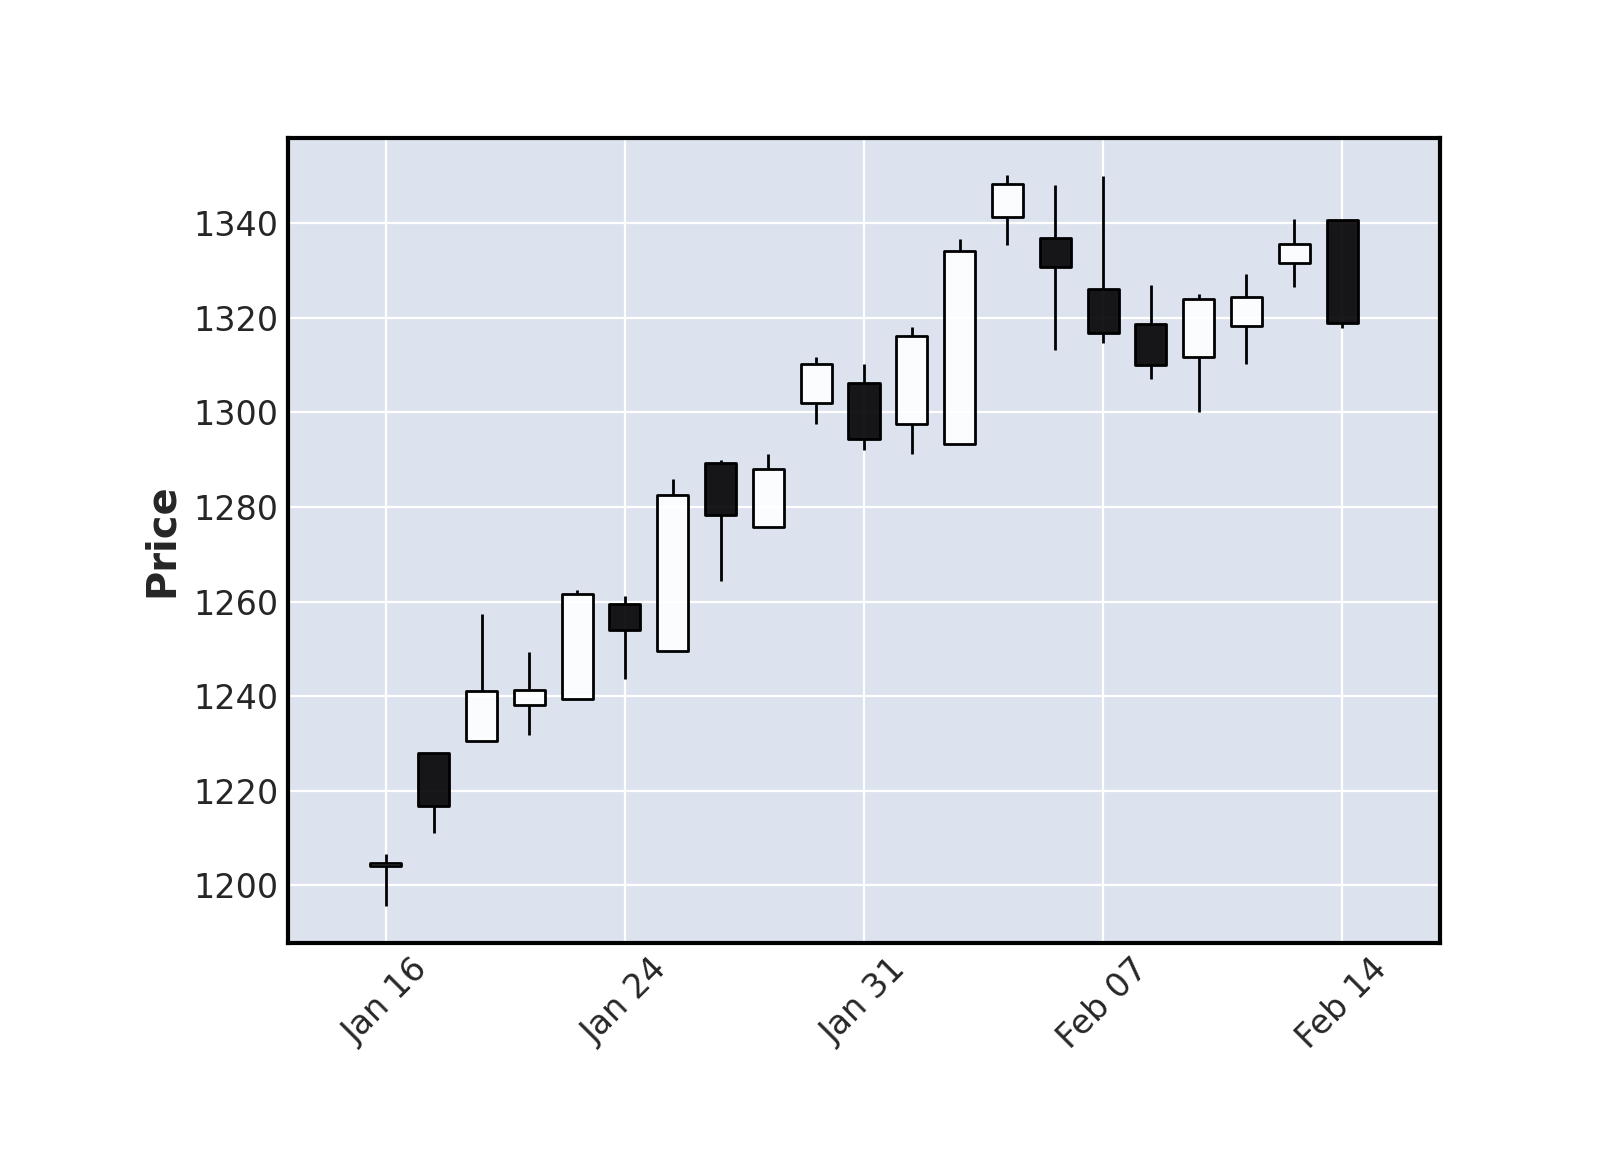
Graphique boursier
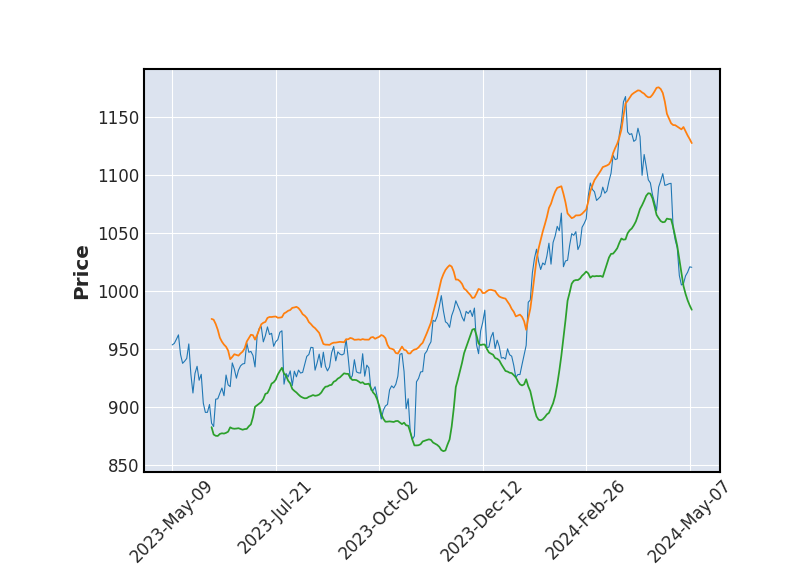 Bollinger
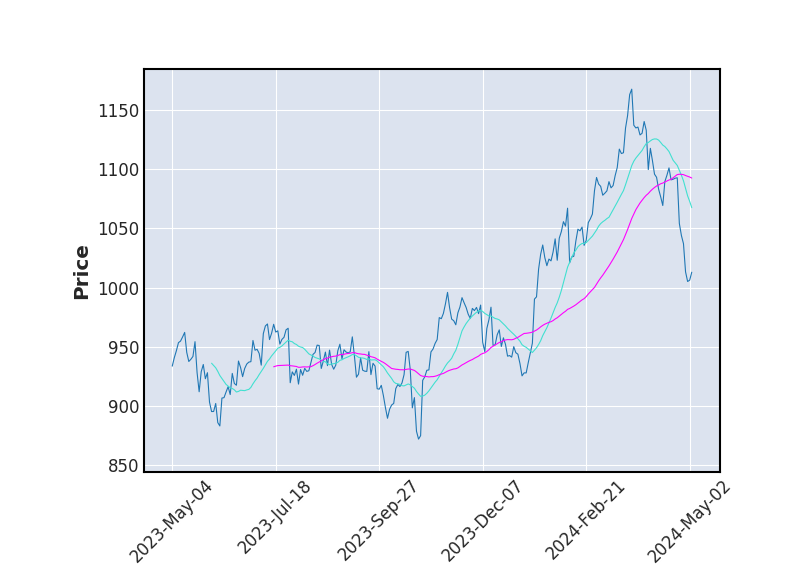 Moyenne Mobile
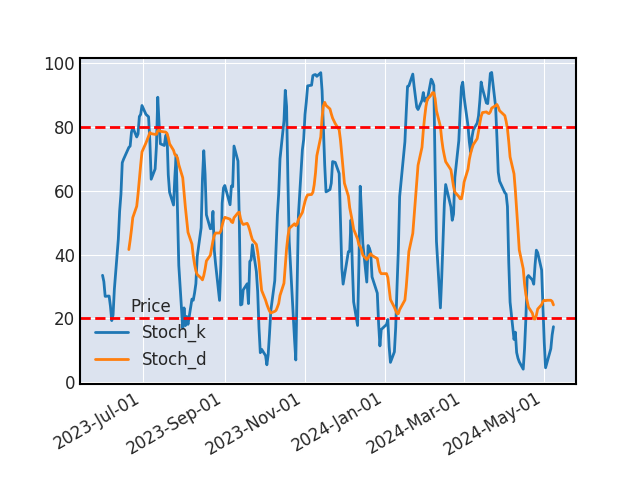 Stochastique
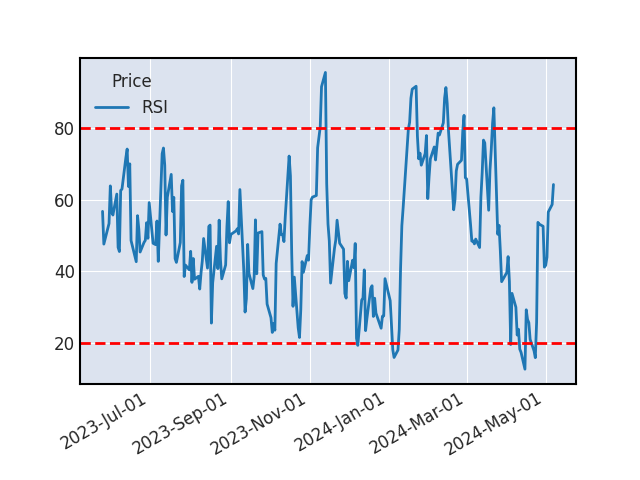 RSI
RSISTOCHASTIQUE
Le stochastique (%K) vient de croiser son signal (%D), une baisse devrait se produire sur le titre (à valider par un indicateur secondaire).
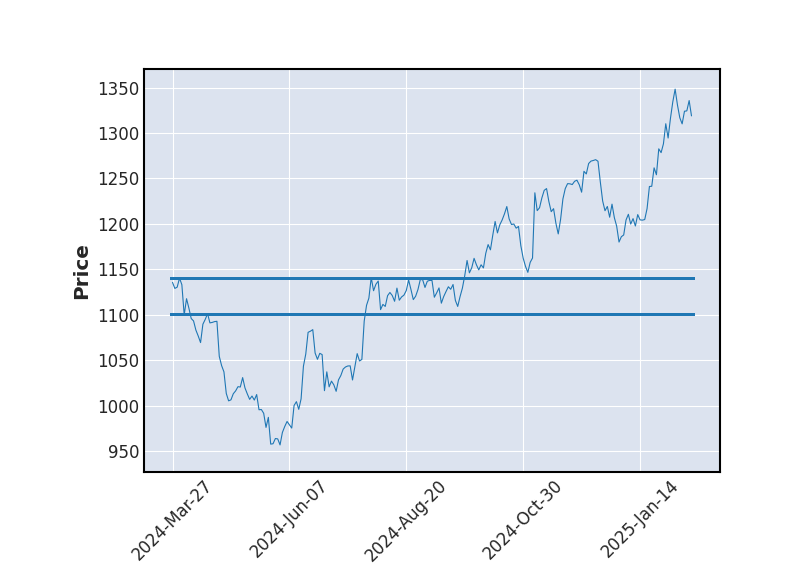
SUPPORTS ET RESISTANCES
| Support Résistance | Rebond | Ecart avec le cours |
|---|---|---|
| 91.39 | 4 | -11.86% |
| 89.58 | 4 | -13.61% |
| 87.86 | 4 | -15.27% |
Historique de cours - O REILLY AUTOMOTIVE
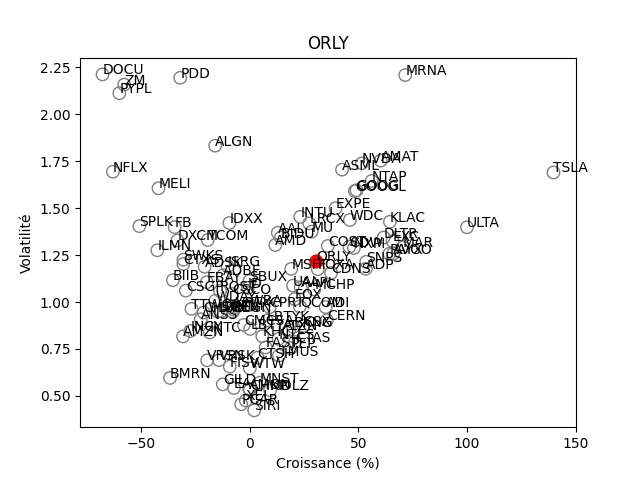
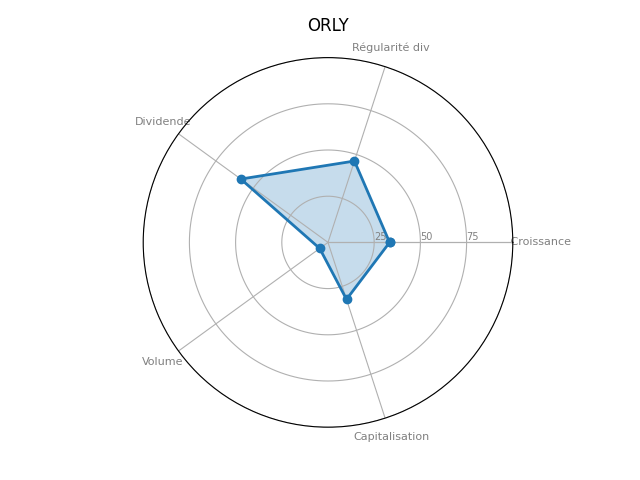
Positionnement boursier de O REILLY AUTOMOTIVE
Version Beta