| Action | MMA | MACD_MME | Bollinger | Stochastique | RSI | Chandelier |
|---|---|---|---|---|---|---|
| SAP AG O.N. | RAS | RAS | RAS | Neutre | RAS | Neutre | RAS |
SAP AG O.N. : 201.85
| 1j | 5j | 1m | 3m | 1a |
|---|---|---|---|---|
| -2.11% | 0% | 0% | 0% | -18.16% |
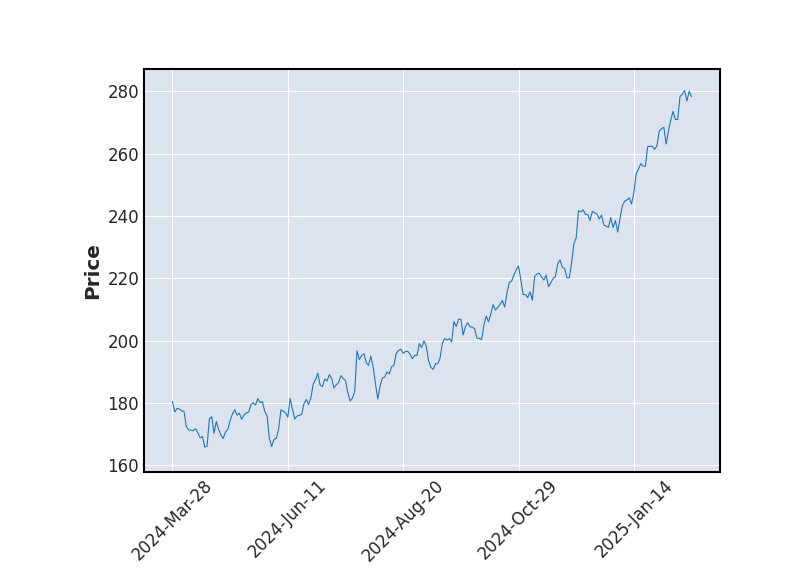
Evolution annuelle
Min : 199.6Moy : 223.17Max : 257.7
|
201.85
| Court terme | Moyen terme | Long terme |
|---|---|---|
 | | |


Analyse Boursicot du 06/01/2026
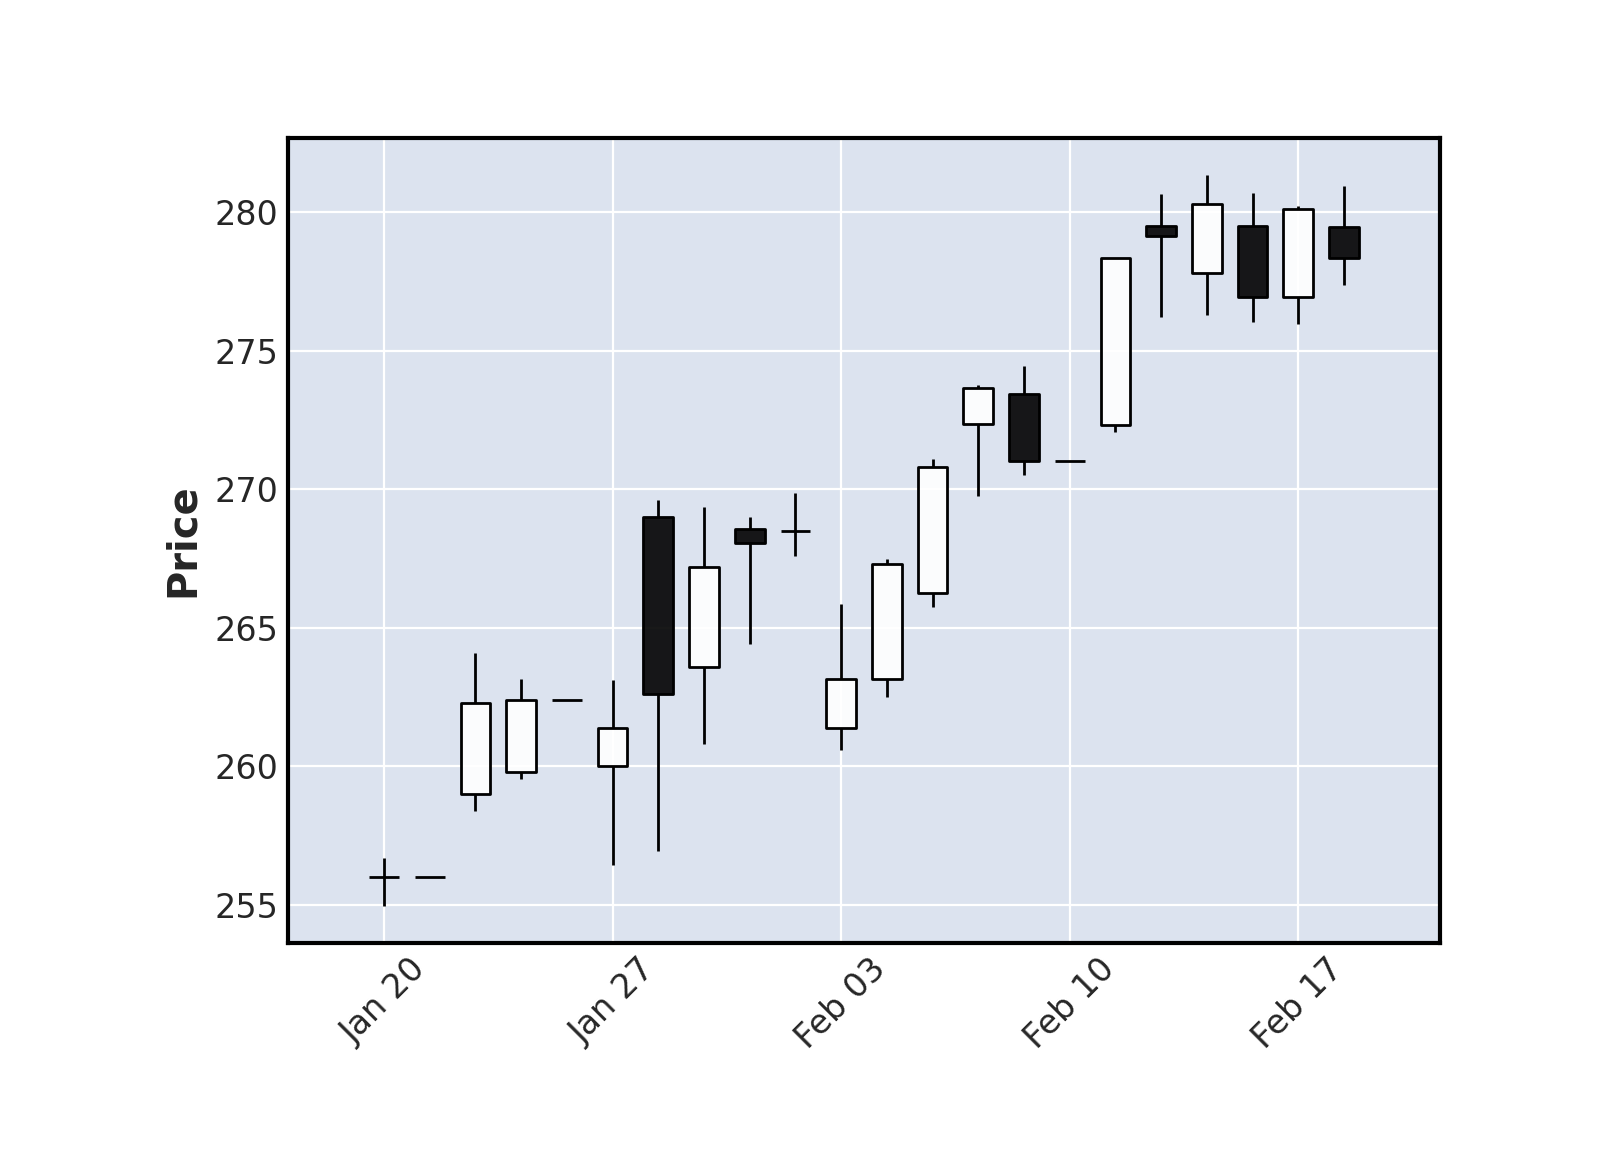
Graphique boursier
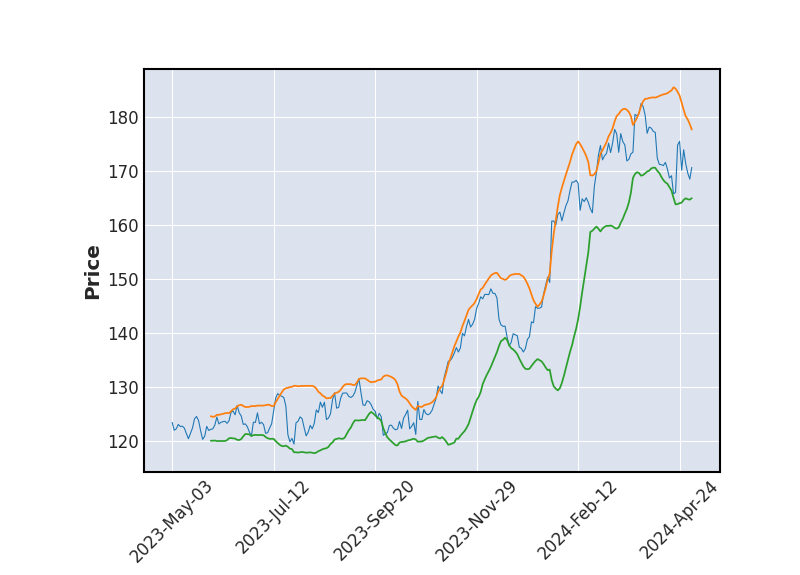 Bollinger
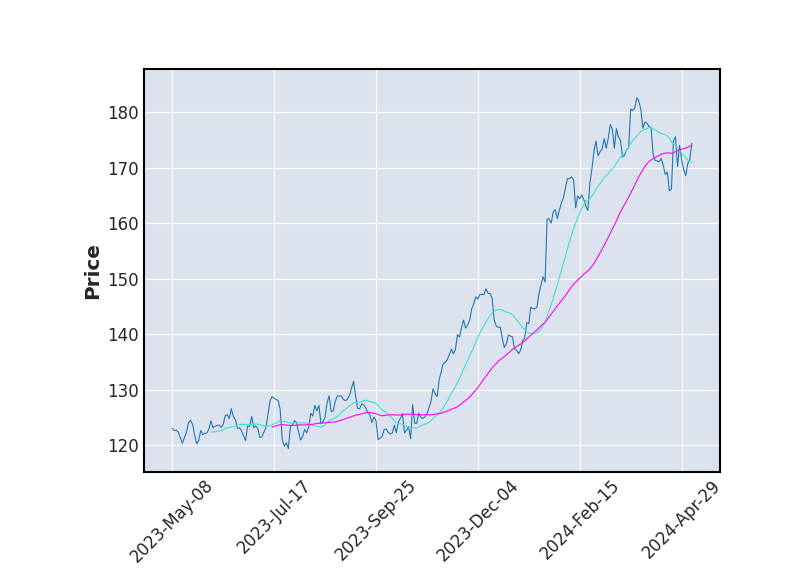 Moyenne Mobile
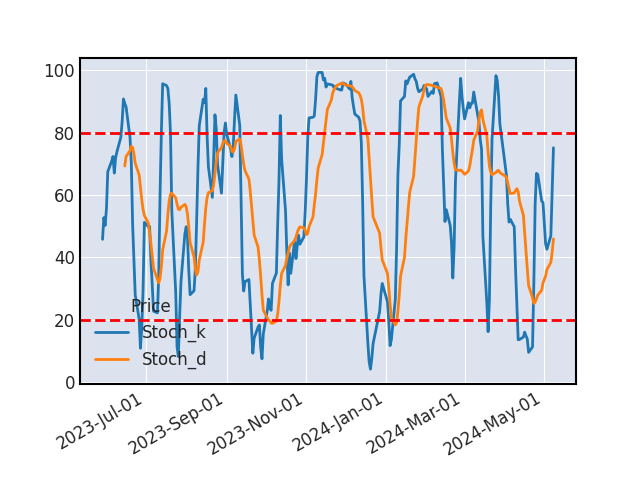 Stochastique
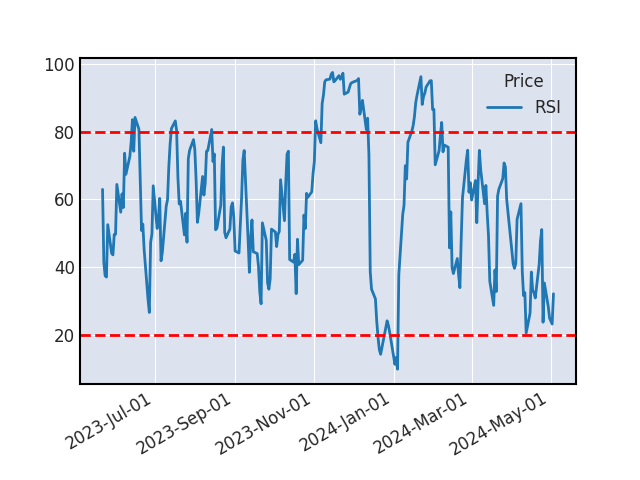 RSI
RSIL'analyse du cours ne permet pas de déterminer de tendance claire.
SUPPORTS ET RESISTANCES
| Support Résistance | Rebond | Ecart avec le cours |
|---|---|---|
| 265.85 | 4 | 31.71% |
| 258.4 | 3 | 28.02% |
| 236.65 | 3 | 17.24% |
| 225.57 | 4 | 11.75% |
Historique de cours - SAP AG O.N.
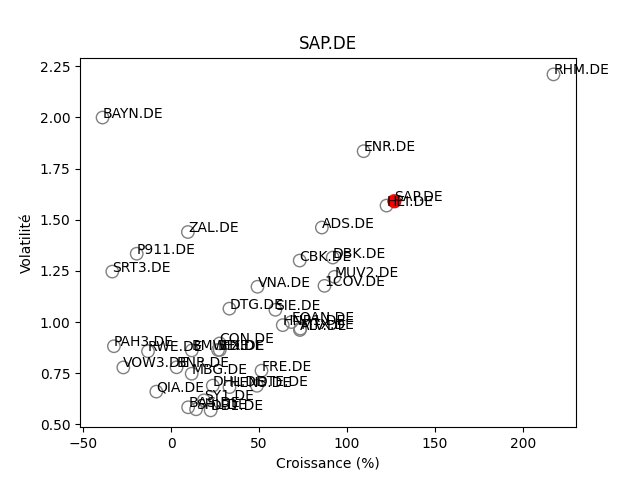
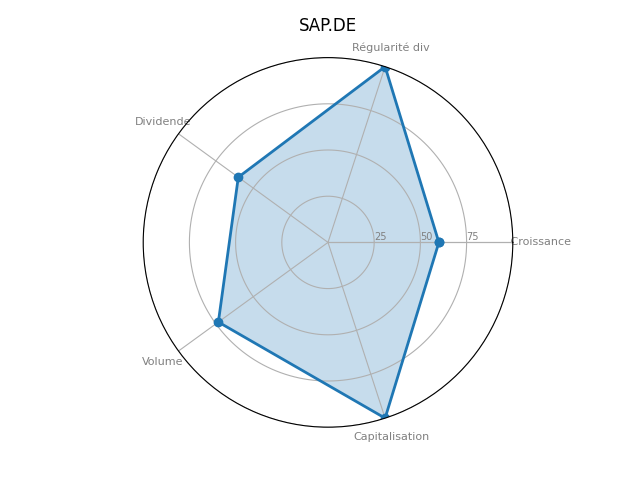
Positionnement boursier de SAP AG O.N.
Version Beta