| Action | MMA | MACD_MME | Bollinger | Stochastique | RSI | Chandelier |
|---|---|---|---|---|---|---|
| SARTORIUS STEDIM BIOTECH | RAS | RAS | RAS | Neutre | RAS | Neutre | RAS |
SARTORIUS STEDIM BIOTECH : 179.3
| 1j | 5j | 1m | 3m | 1a |
|---|---|---|---|---|
| -0.06% | -0.5% | -0.06% | 6.16% | -12.83% |
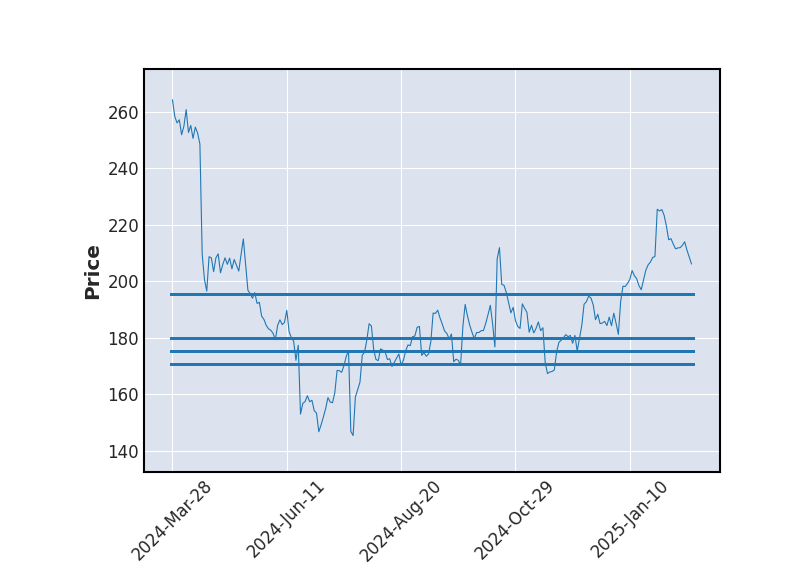
Evolution annuelle
Min : 150Moy : 183.78Max : 224
|
179.3
| Court terme | Moyen terme | Long terme |
|---|---|---|
 | |  |


Analyse Boursicot du 07/07/2026
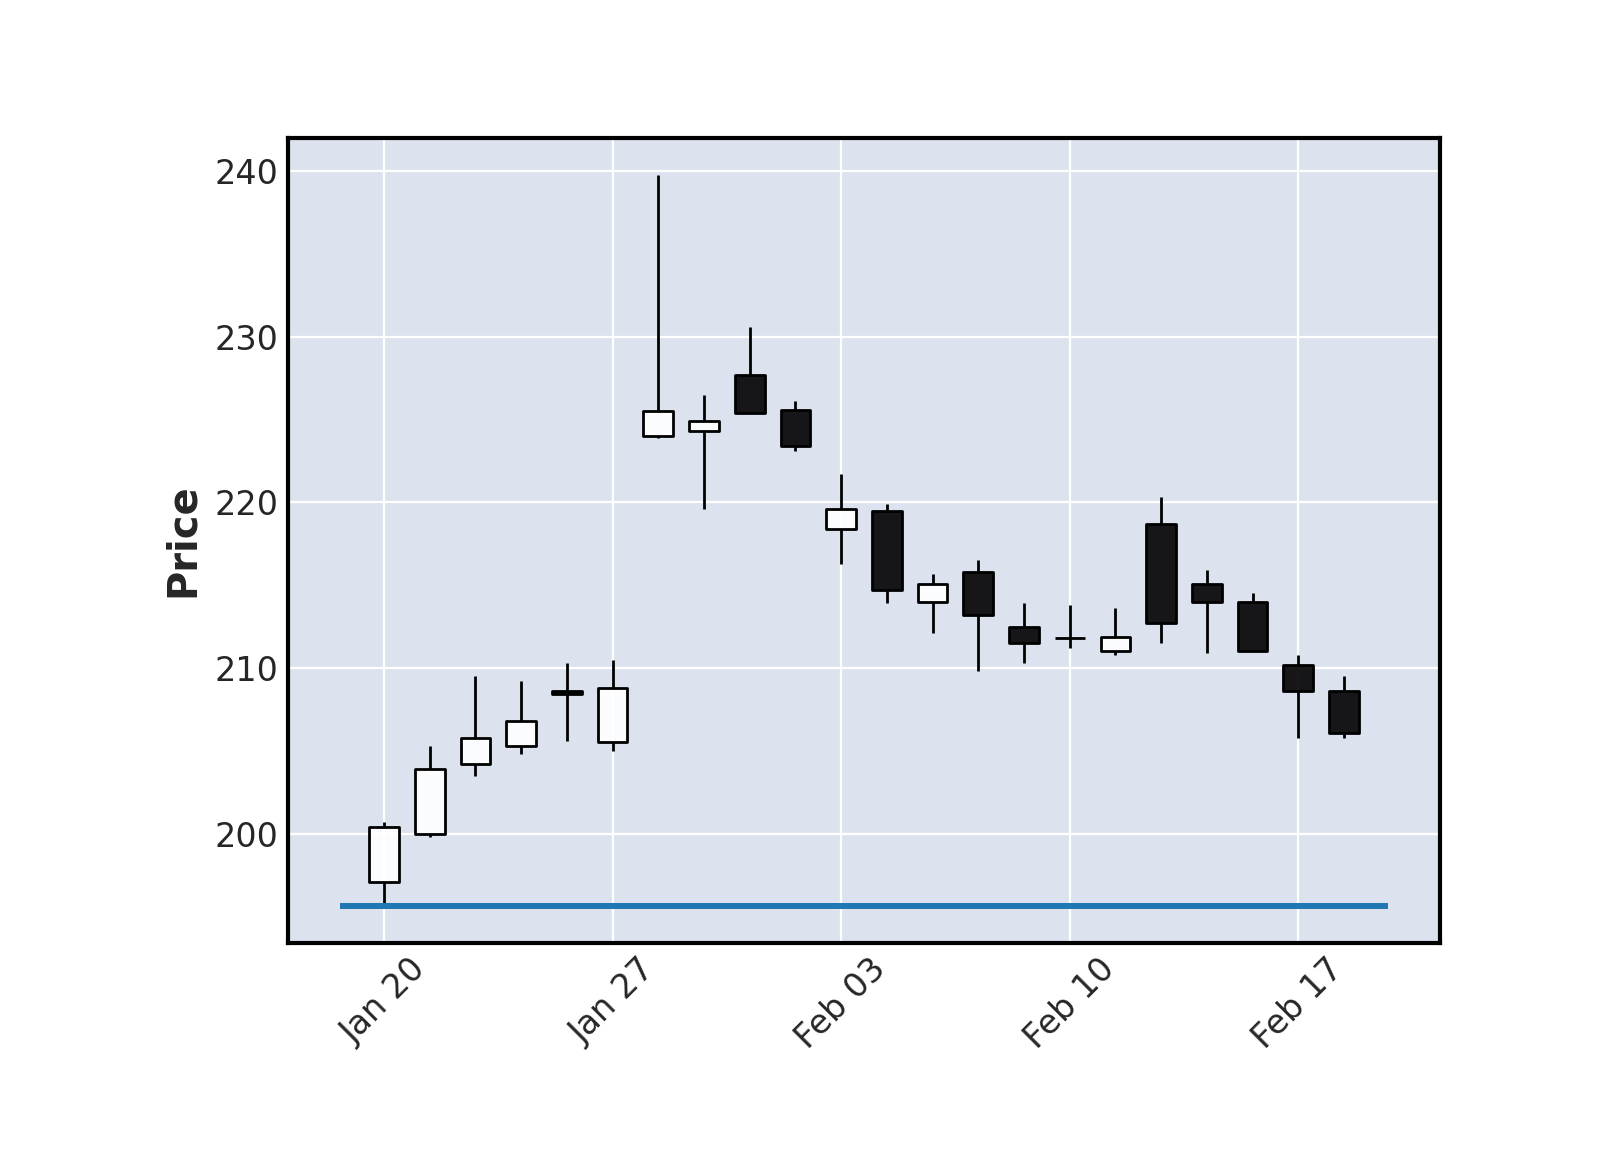
Graphique boursier
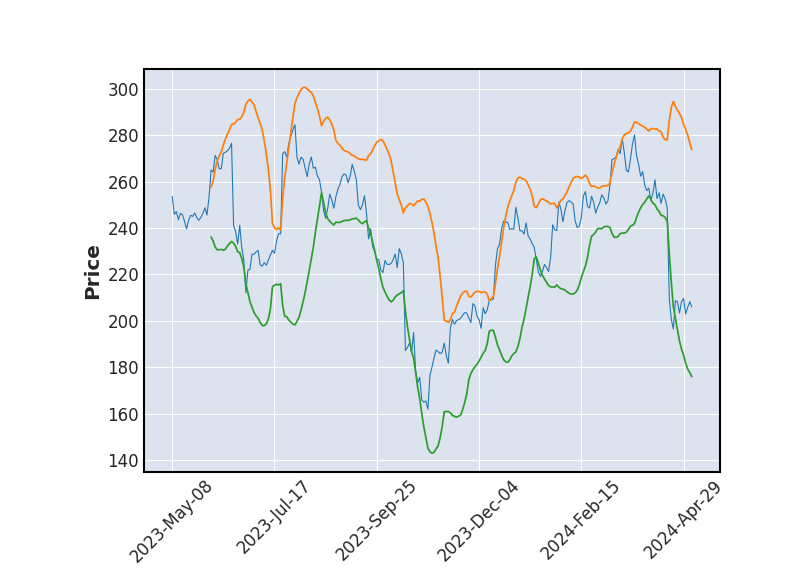 Bollinger
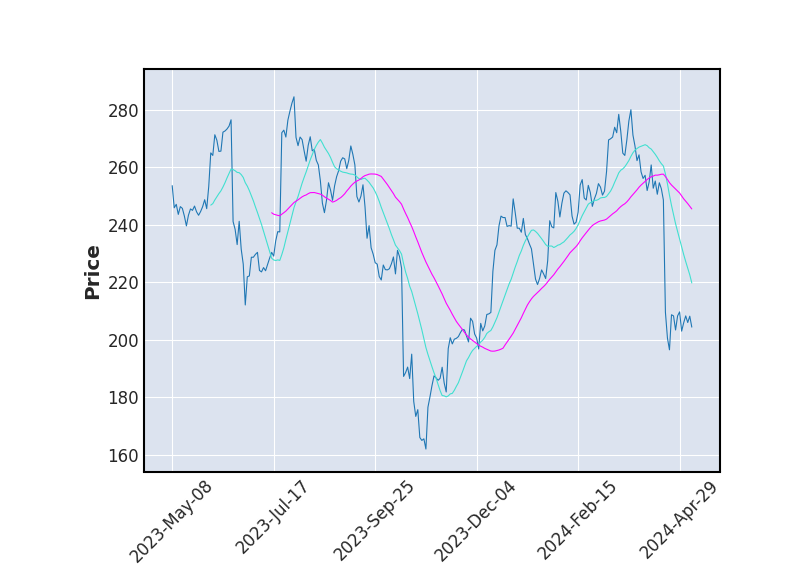 Moyenne Mobile
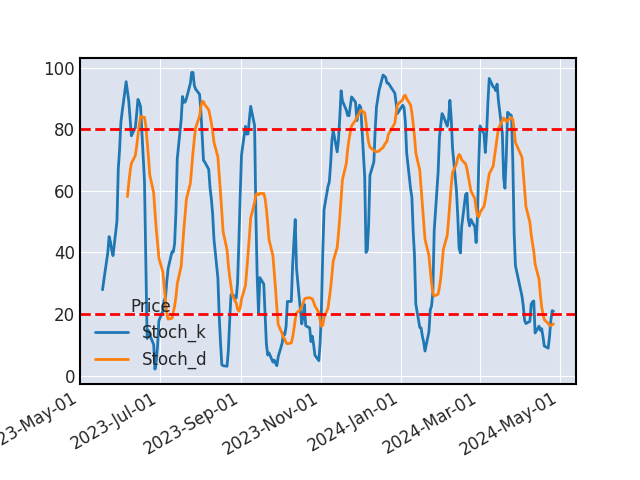 Stochastique
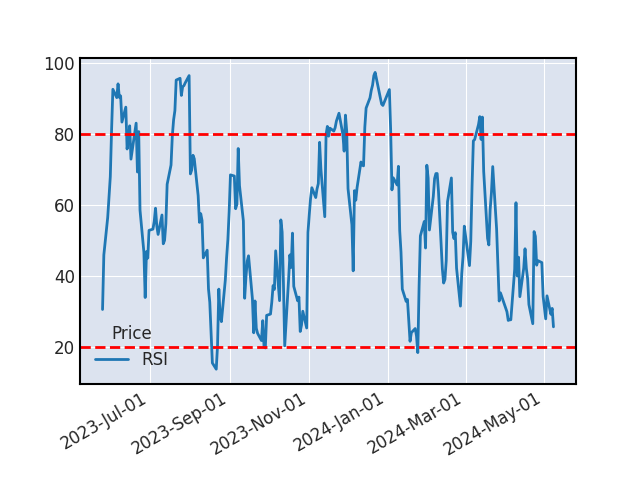 RSI
RSIAucun indicateur ne laisse présager d'une hausse ou d'une baisse à venir.
SUPPORTS ET RESISTANCES
| Support Résistance | Rebond | Ecart avec le cours |
|---|---|---|
| 187.2 | 3 | 4.41% |
| 183.22 | 4 | 2.18% |
| 178.65 | 3 | -0.36% |
| 166.98 | 4 | -6.87% |
Historique de cours - SARTORIUS STEDIM BIOTECH
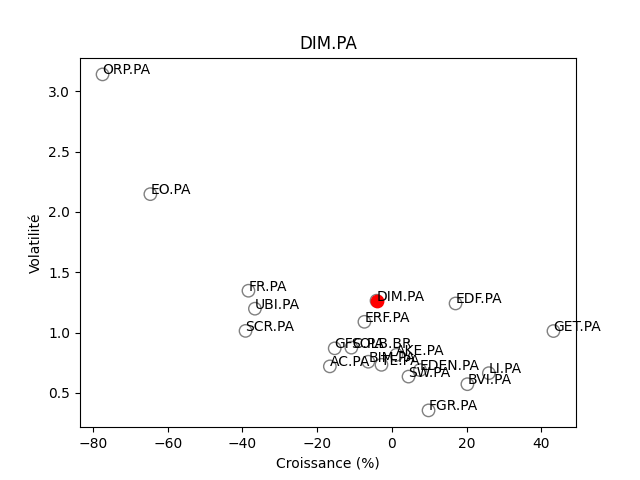
Positionnement boursier de SARTORIUS STEDIM BIOTECH

Version Beta