| Action | MMA | MACD_MME | Bollinger | Stochastique | RSI | Chandelier |
|---|---|---|---|---|---|---|
| SIEMENS | Signal ↑↑ : 0.004% | RAS | RAS | Neutre | Signal ↑↑↑ : 8.06% | Neutre | RAS |
SIEMENS : 247.45
| 1j | 5j | 1m | 3m | 1a |
|---|---|---|---|---|
| 1.17% | 0% | 0% | 0% | 12.32% |
Evolution annuelle
Min : 212.95Moy : 233.1Max : 252.65
|
247.45
| Court terme | Moyen terme | Long terme |
|---|---|---|
 |  | |


Analyse Boursicot du 06/01/2026
Graphique boursier
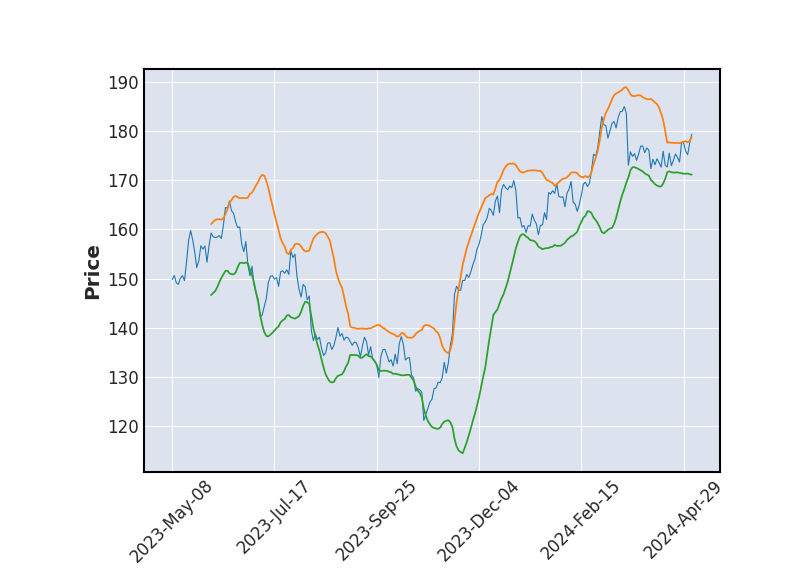 Bollinger
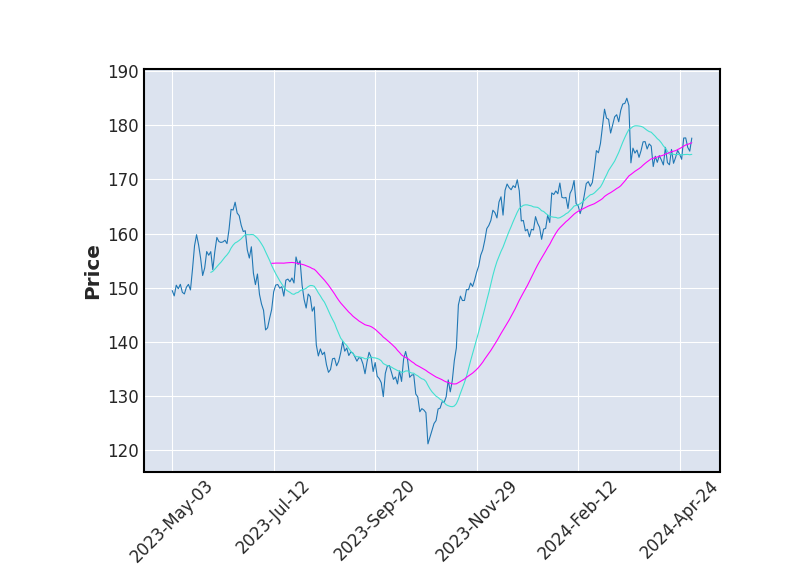 Moyenne Mobile
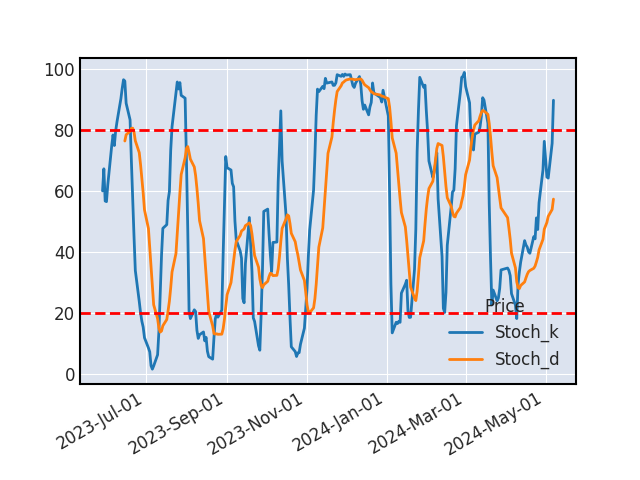 Stochastique
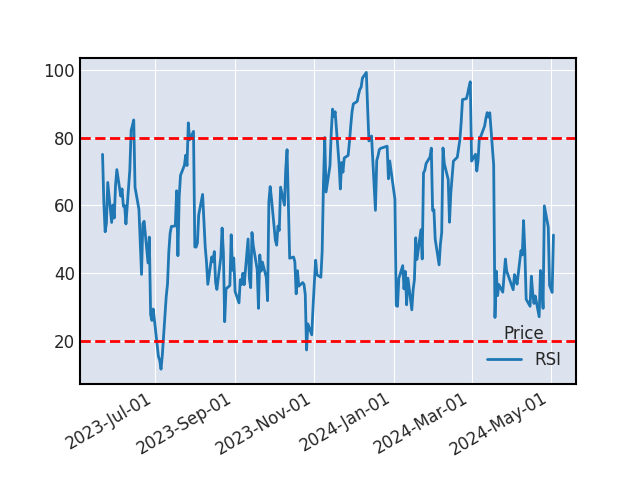 RSI
RSIMMA
La divergence des MMA20 et MMA50 se confirme, ce signal pourrait indiquer que la hausse se confirme.
STOCHASTIQUE
Le stochastique et son signal viennent de se croiser, indiquant une hausse à venir sur le titre (il est recommandé de valider ce signal haussier par un indicateur complémentaire).
VOLUME
Nous constatons plus de 50% d'échange de moins que d'habitude sur le titre.
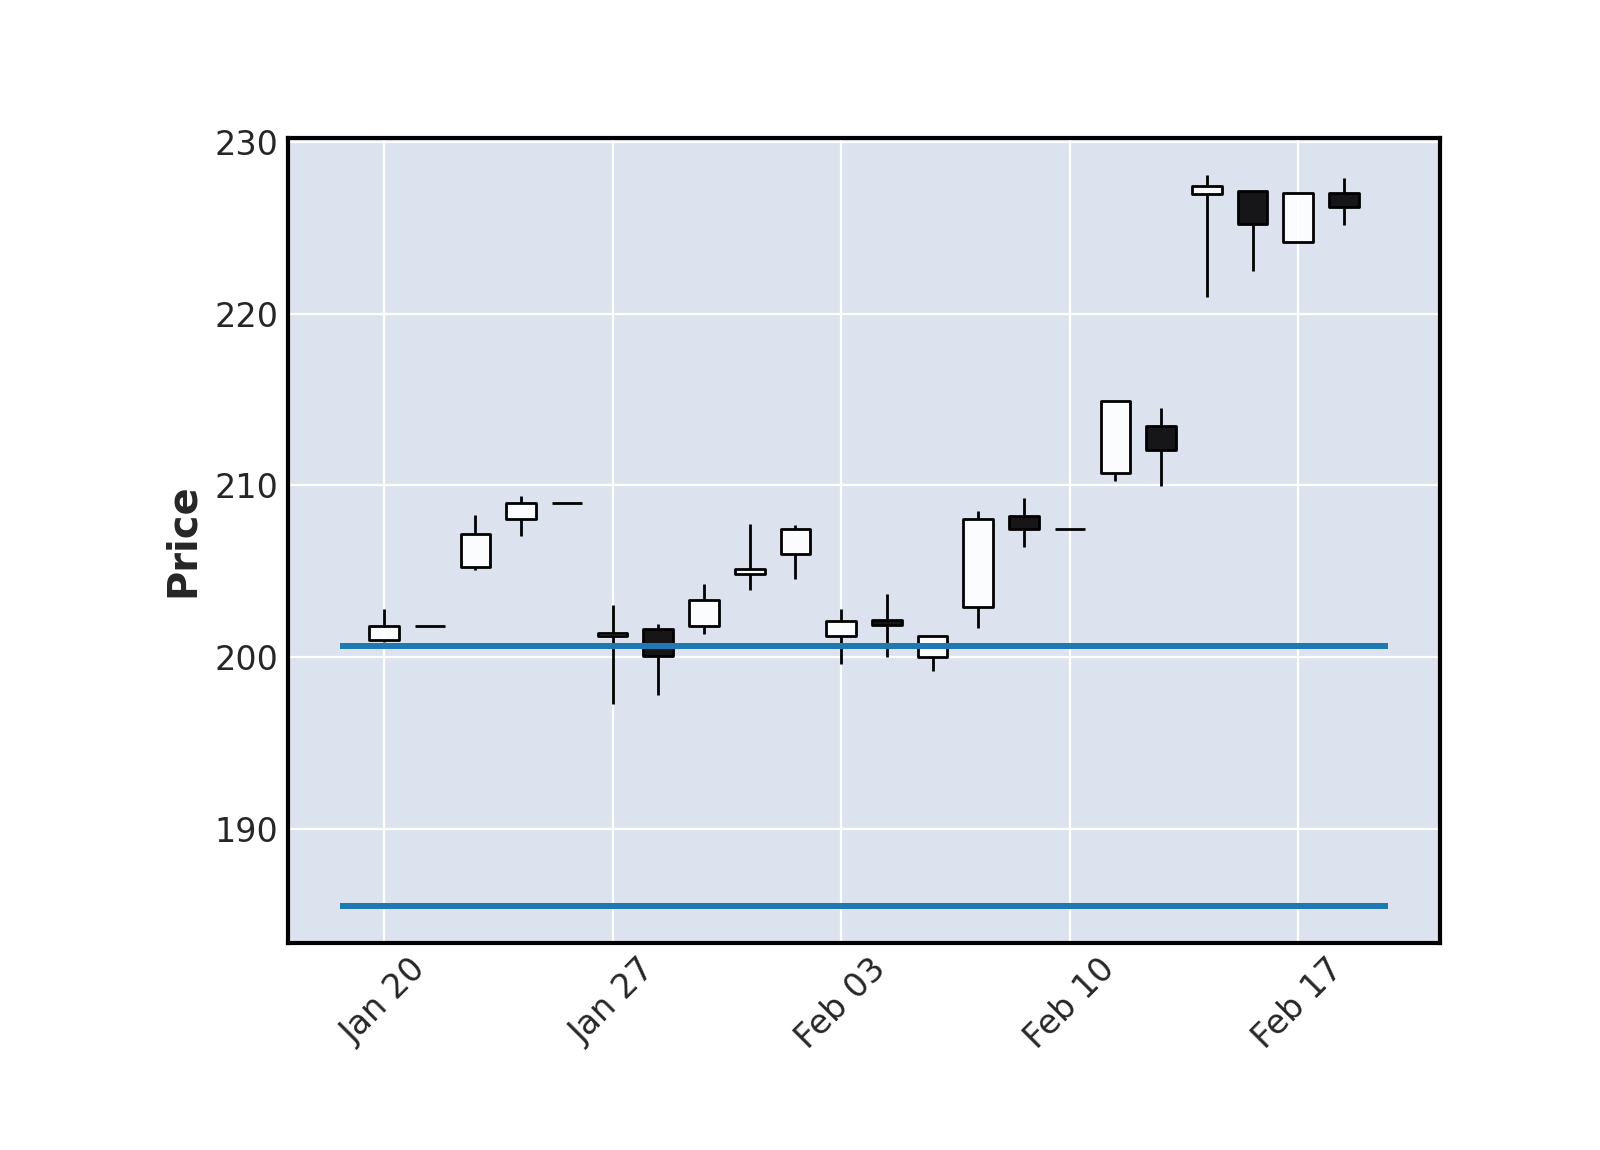
SUPPORTS ET RESISTANCES
| Support Résistance | Rebond | Ecart avec le cours |
|---|---|---|
| 237.29 | 5 | -4.11% |
| 225.86 | 8 | -8.73% |
| 212.38 | 3 | -14.17% |
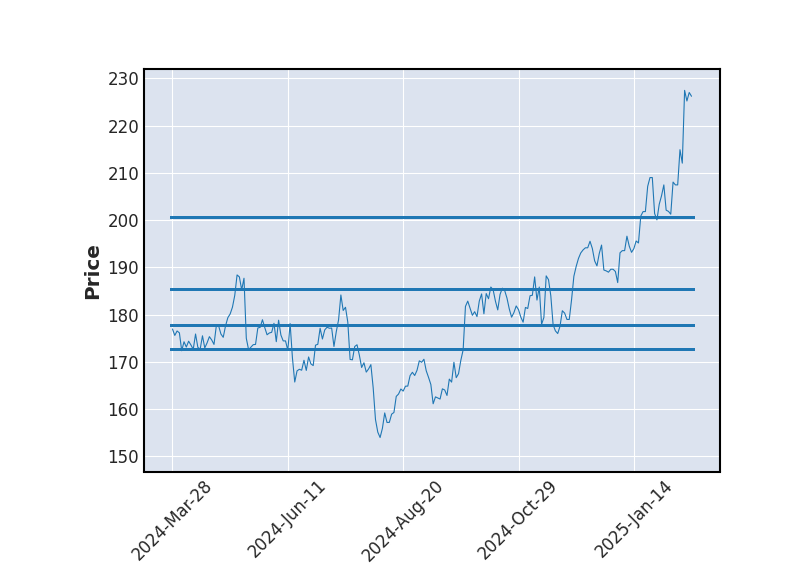
Historique de cours - SIEMENS
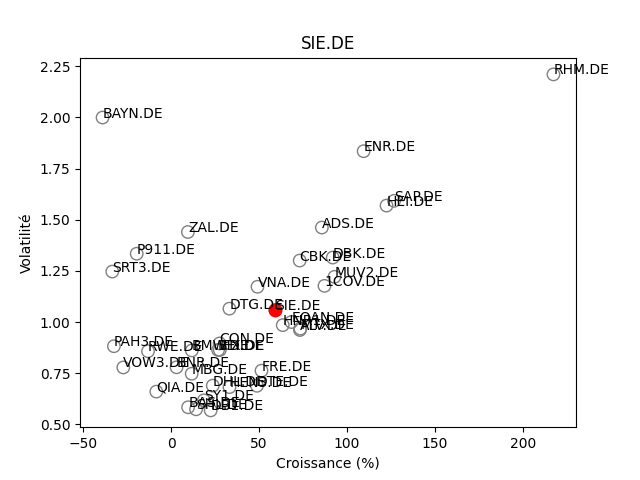
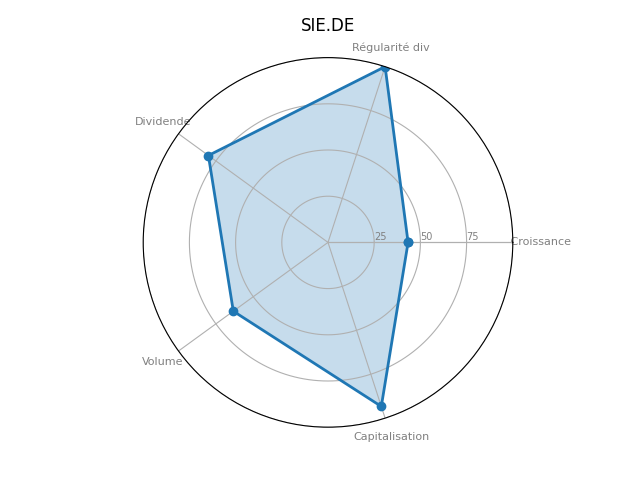
Positionnement boursier de SIEMENS
Version Beta