| Action | MMA | MACD_MME | Bollinger | Stochastique | RSI | Chandelier |
|---|---|---|---|---|---|---|
| SOCIETE GENERALE | RAS | RAS | RAS | Neutre | RAS | Neutre | RAS |
SOCIETE GENERALE : 69.86
| 1j | 5j | 1m | 3m | 1a |
|---|---|---|---|---|
| -0.65% | 0% | 0% | 0% | 33.42% |
Evolution annuelle
Min : 50.9Moy : 58.01Max : 71.18
|
69.86
| Court terme | Moyen terme | Long terme |
|---|---|---|
 | | |


Analyse Boursicot du 06/01/2026
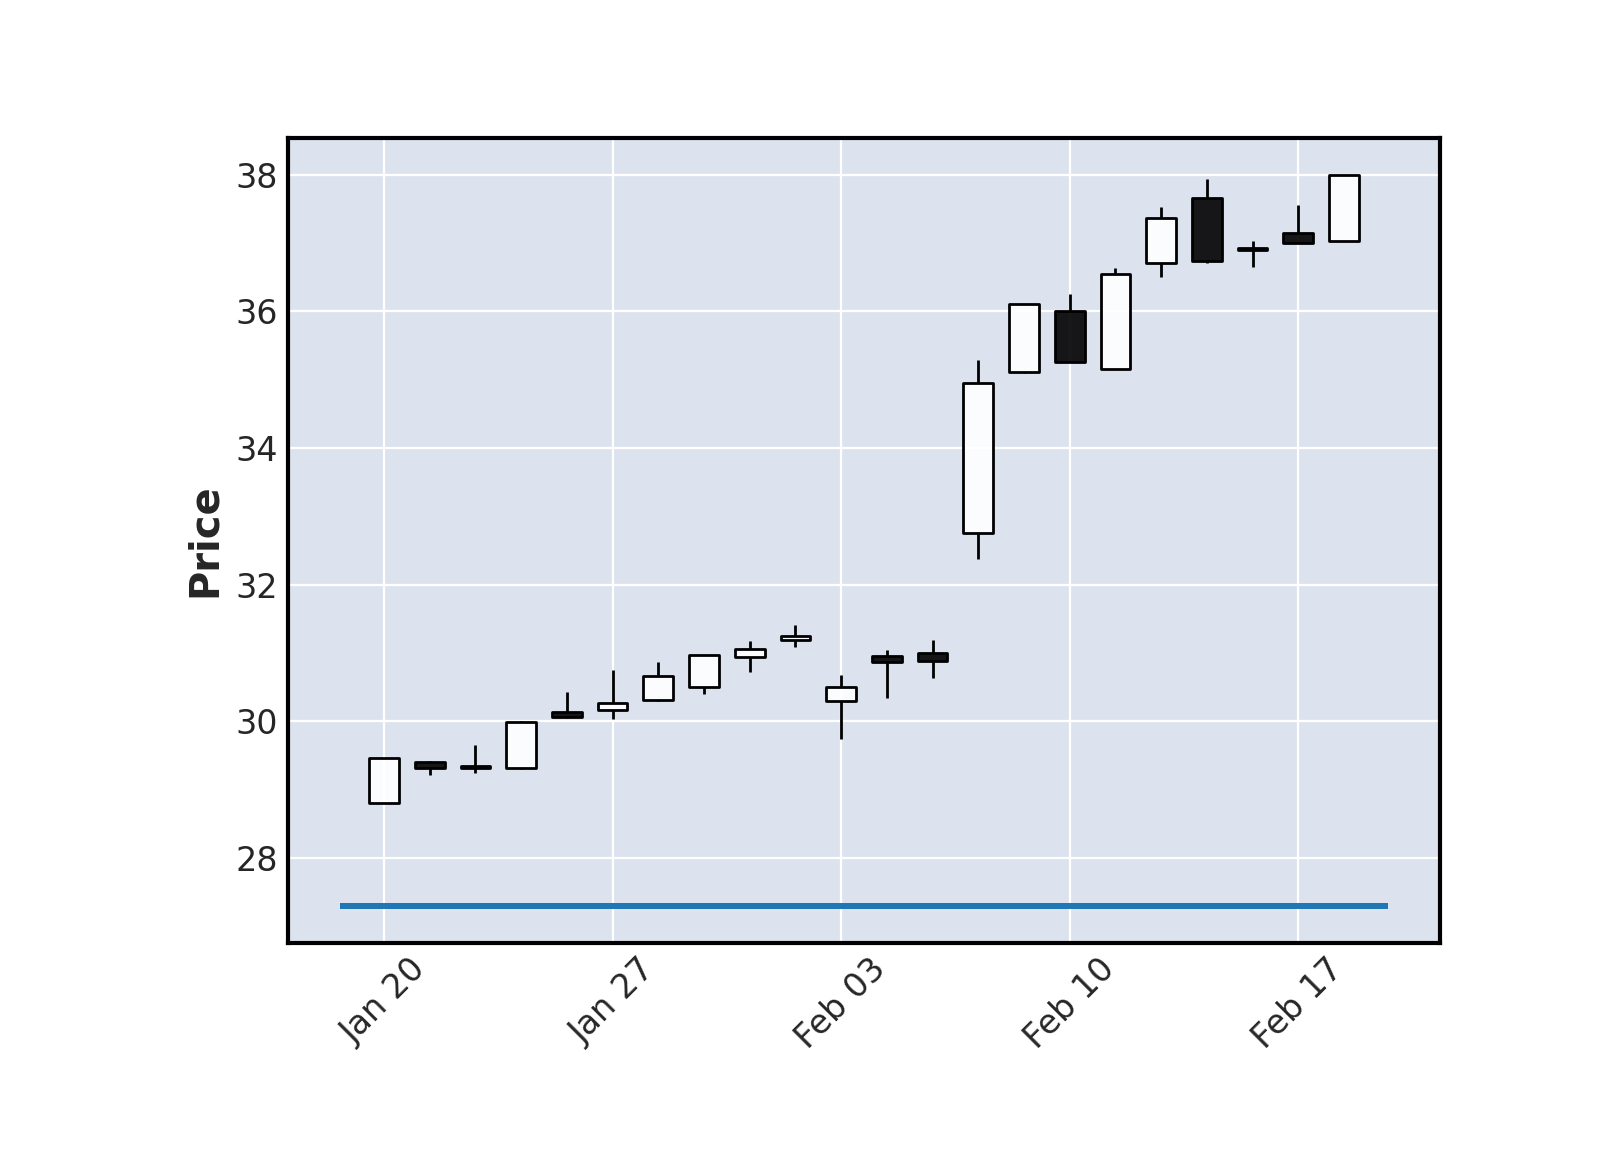
Graphique boursier
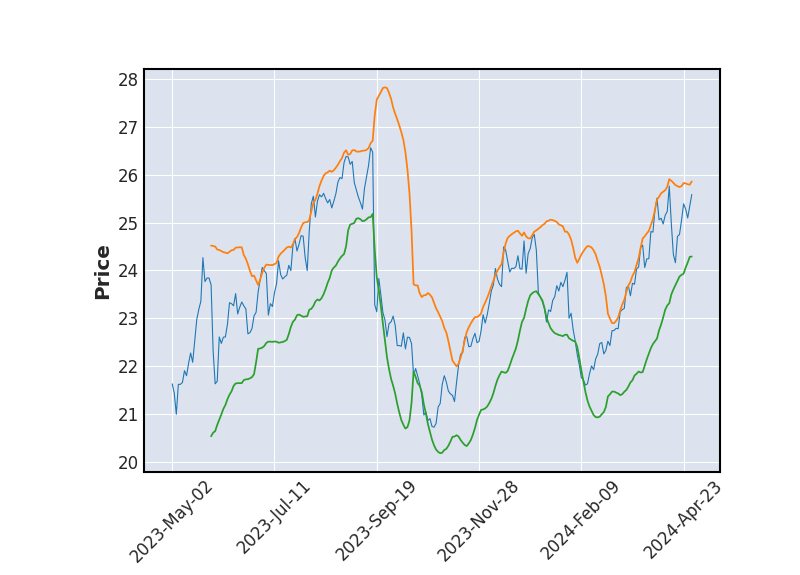 Bollinger
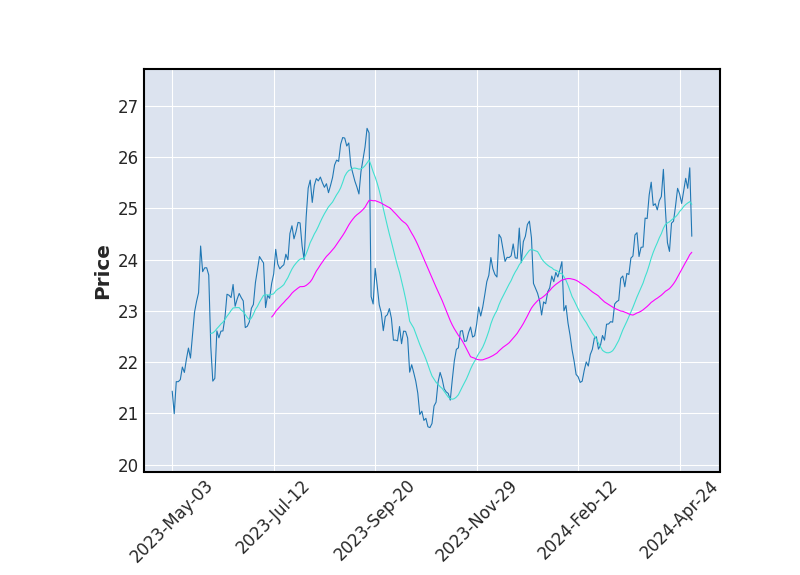 Moyenne Mobile
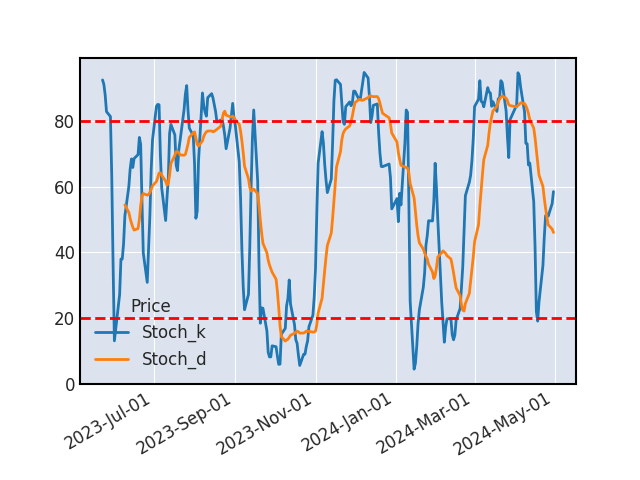 Stochastique
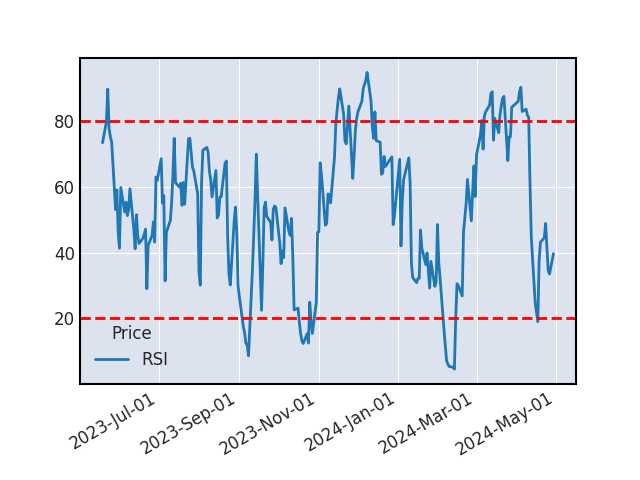 RSI
RSIL'analyse du cours ne permet pas de déterminer de tendance claire.
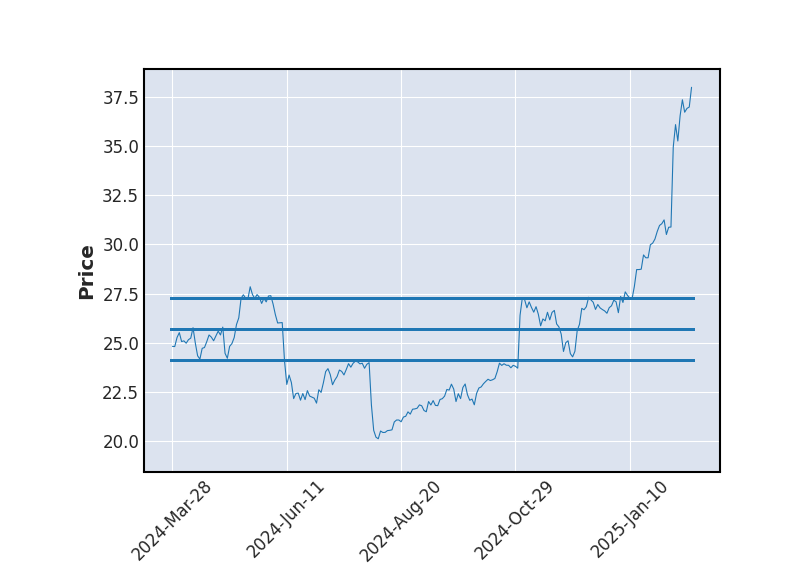
SUPPORTS ET RESISTANCES
| Support Résistance | Rebond | Ecart avec le cours |
|---|---|---|
| 58.93 | 3 | -15.64% |
| 52.94 | 3 | -24.22% |
| 49.2 | 3 | -29.57% |
Historique de cours - SOCIETE GENERALE
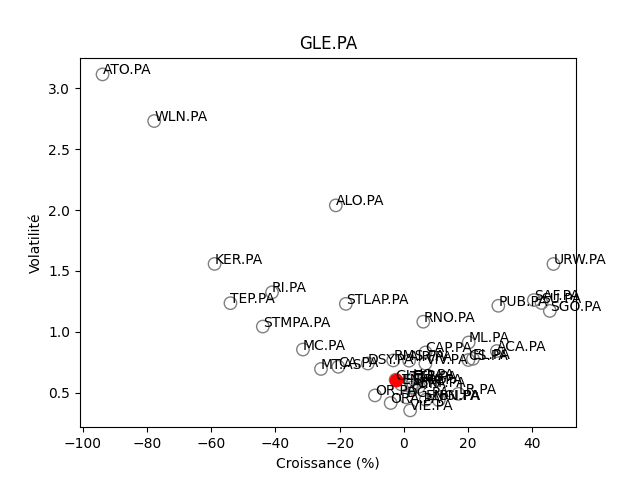
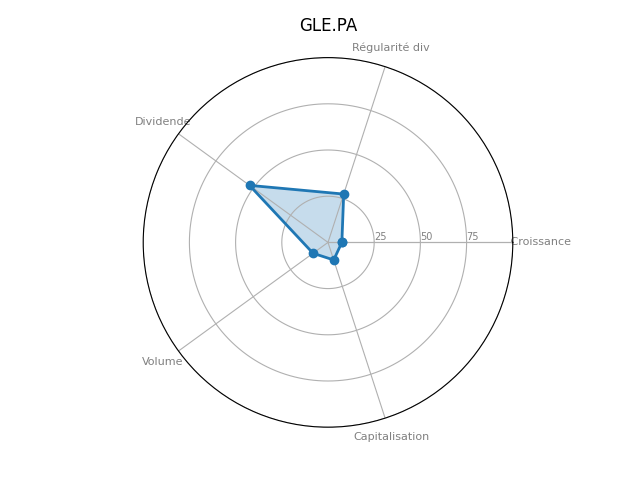
Positionnement boursier de SOCIETE GENERALE
Version Beta