| Action | MMA | MACD_MME | Bollinger | Stochastique | RSI | Chandelier |
|---|---|---|---|---|---|---|
| THALES | RAS | RAS | RAS | Neutre | Signal ↑↑↑ : 27.06% | Neutre | RAS |
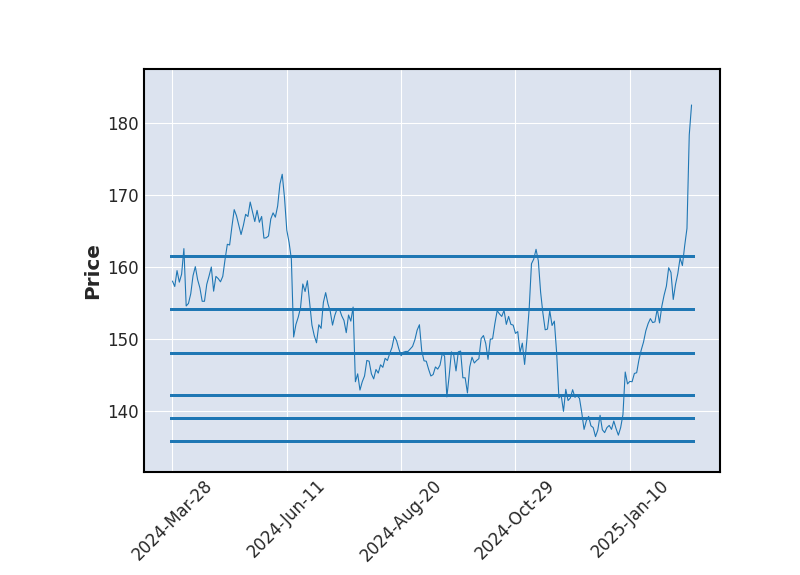
THALES : 247.9
| 1j | 5j | 1m | 3m | 1a |
|---|---|---|---|---|
| 0.73% | 0% | 0% | 0% | 0.69% |
Evolution annuelle
Min : 216.2Moy : 240.26Max : 279.3
|
247.9
| Court terme | Moyen terme | Long terme |
|---|---|---|
 |  | |


Analyse Boursicot du 06/01/2026
Graphique boursier
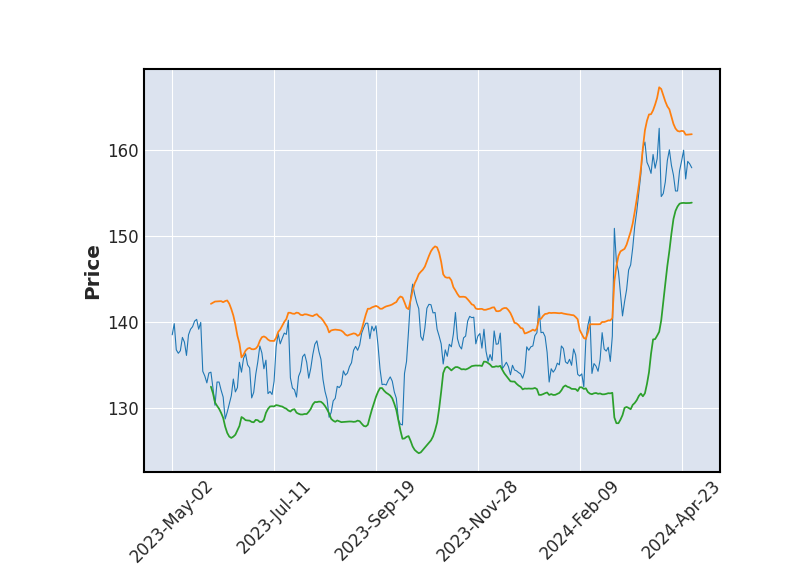 Bollinger
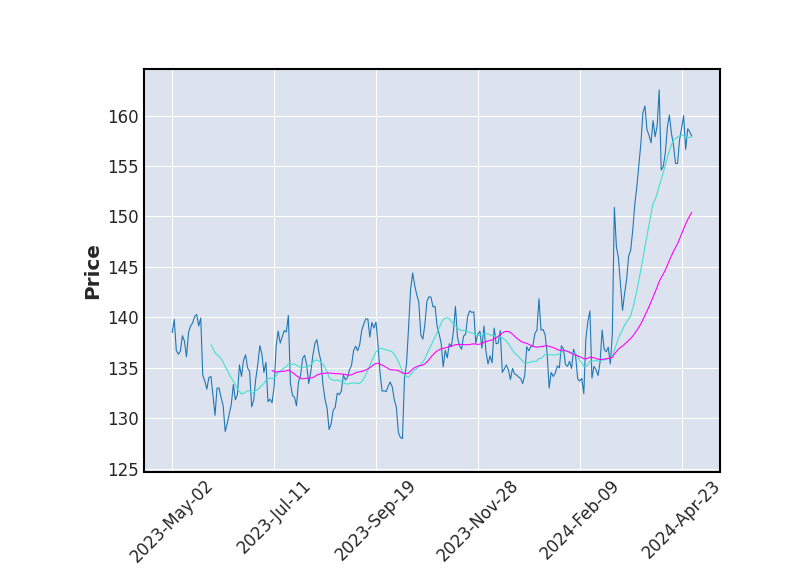 Moyenne Mobile
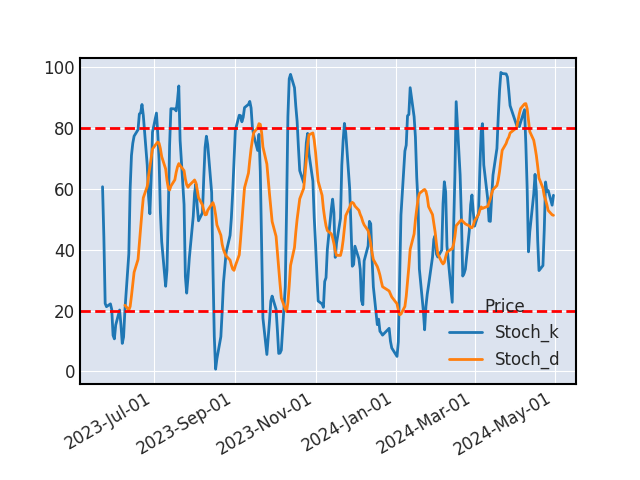 Stochastique
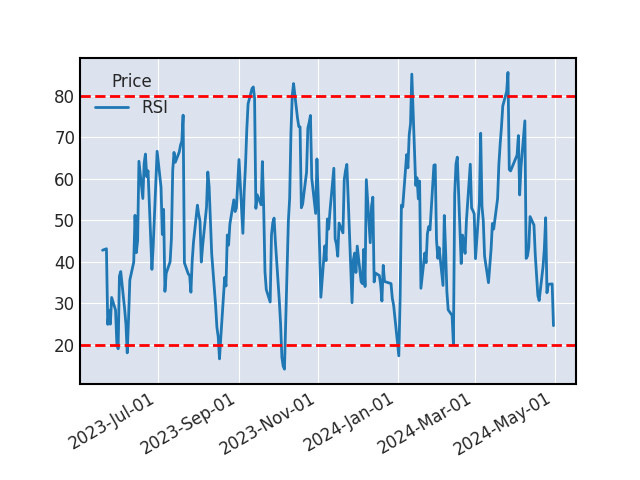 RSI
RSISTOCHASTIQUE
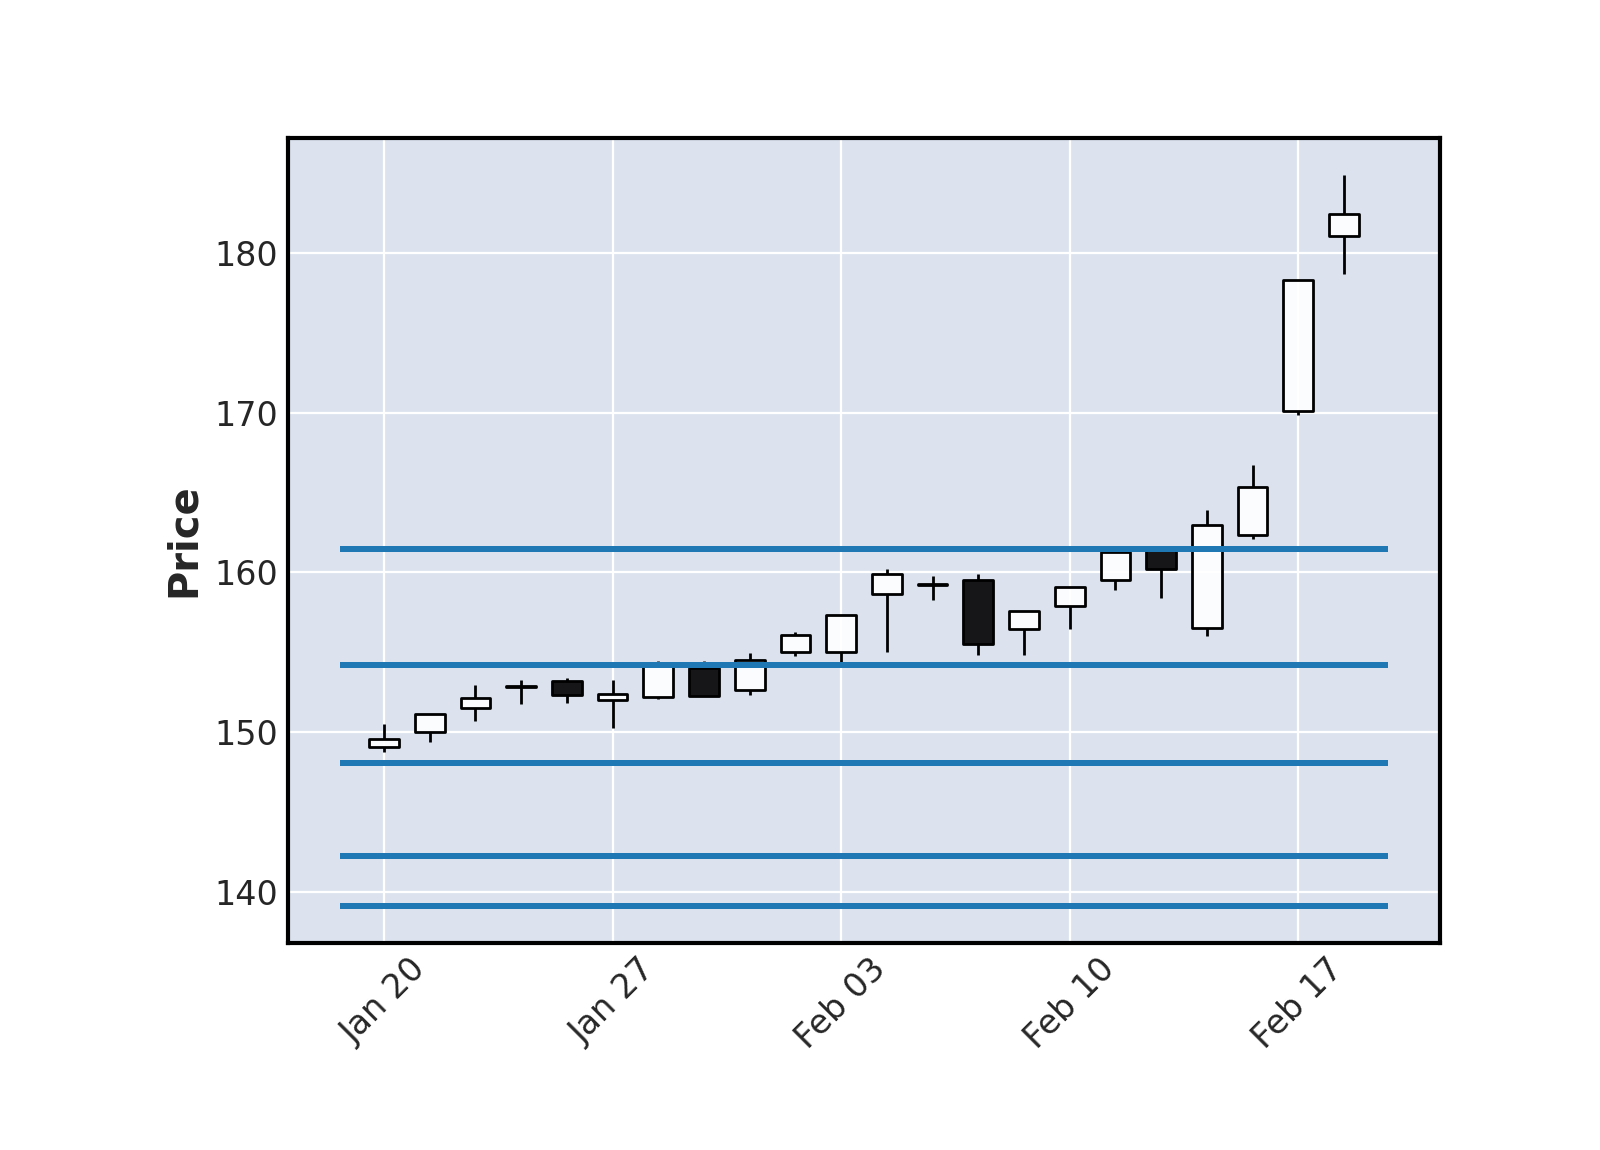
Le stochastique (%K) vient de croiser son signal (%D), une hausse devrait se produire sur le titre (à valider par un indicateur secondaire).
SUPPORTS ET RESISTANCES
| Support Résistance | Rebond | Ecart avec le cours |
|---|---|---|
| 272.67 | 3 | 9.99% |
| 260.2 | 3 | 4.96% |
| 252.32 | 5 | 1.78% |
| 245.43 | 4 | -1.0% |
| 238.18 | 6 | -3.92% |
| 227.73 | 4 | -8.14% |
Historique de cours - THALES
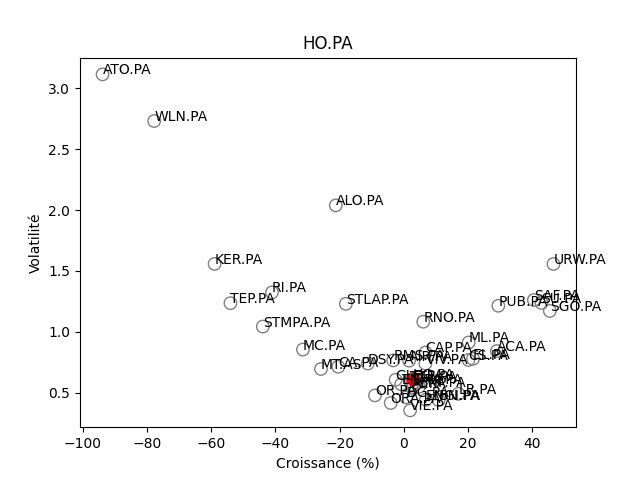
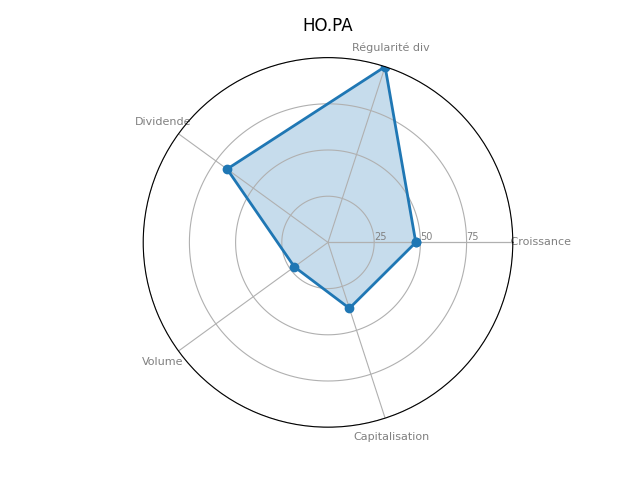
Positionnement boursier de THALES
Version Beta