| Action | MMA | MACD_MME | Bollinger | Stochastique | RSI | Chandelier |
|---|---|---|---|---|---|---|
| UBISOFT | RAS | RAS | RAS | Neutre | RAS | Neutre | RAS |
UBISOFT : 4.72
| 1j | 5j | 1m | 3m | 1a |
|---|---|---|---|---|
| -14.34% | -14.34% | -5.22% | -0.42% | -49.3% |
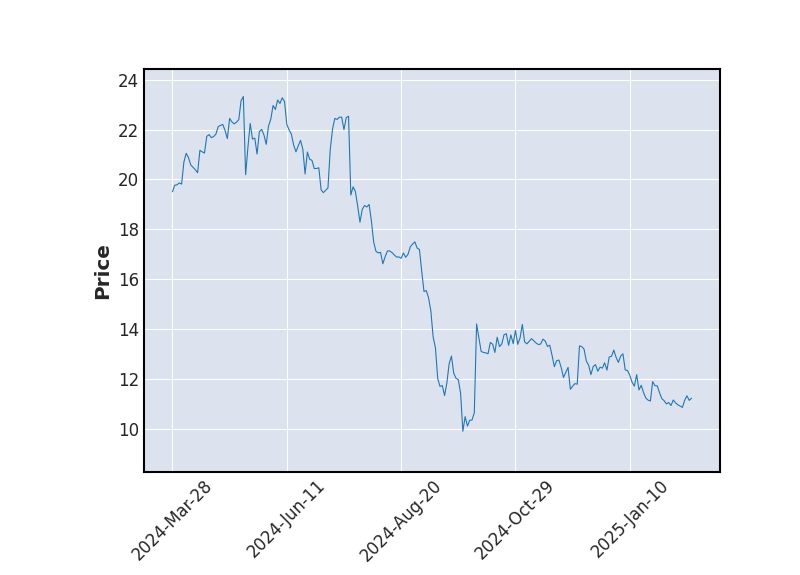
Evolution annuelle
Min : 3.7Moy : 6.27Max : 10.31
|
4.72
| Court terme | Moyen terme | Long terme |
|---|---|---|
 |  | |


Analyse Boursicot du 23/07/2026
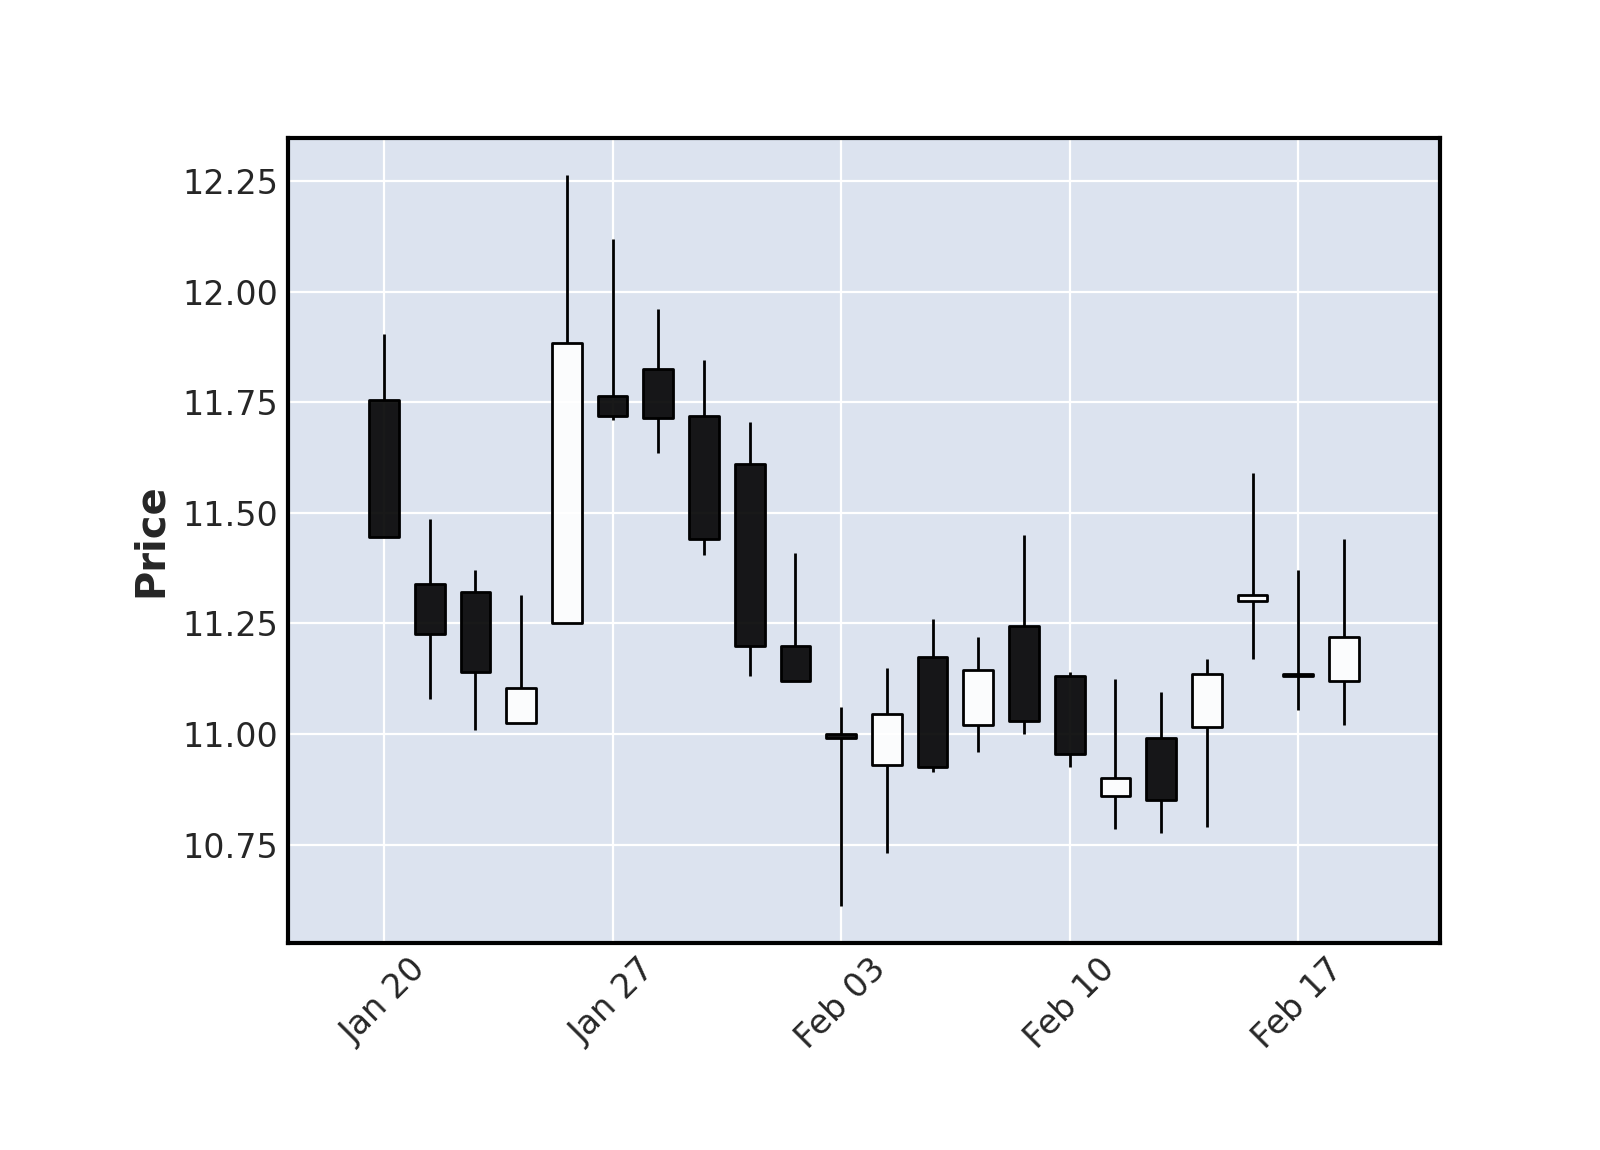
Graphique boursier
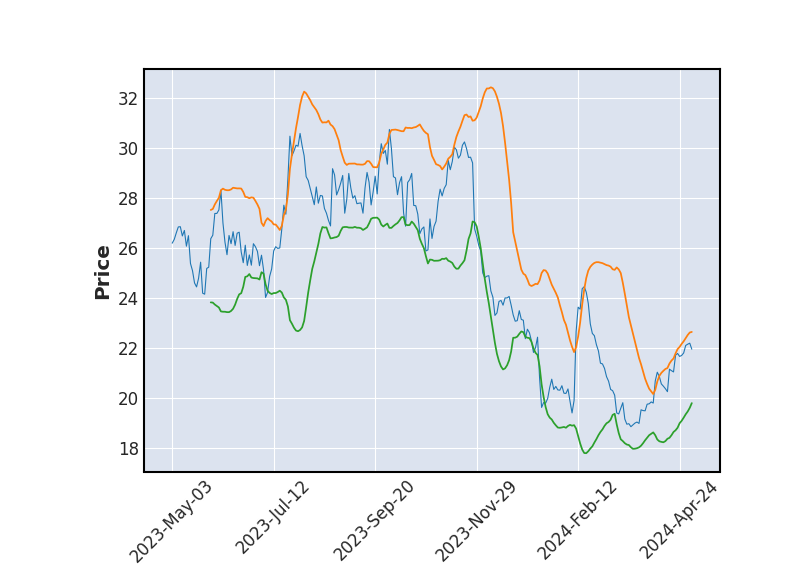 Bollinger
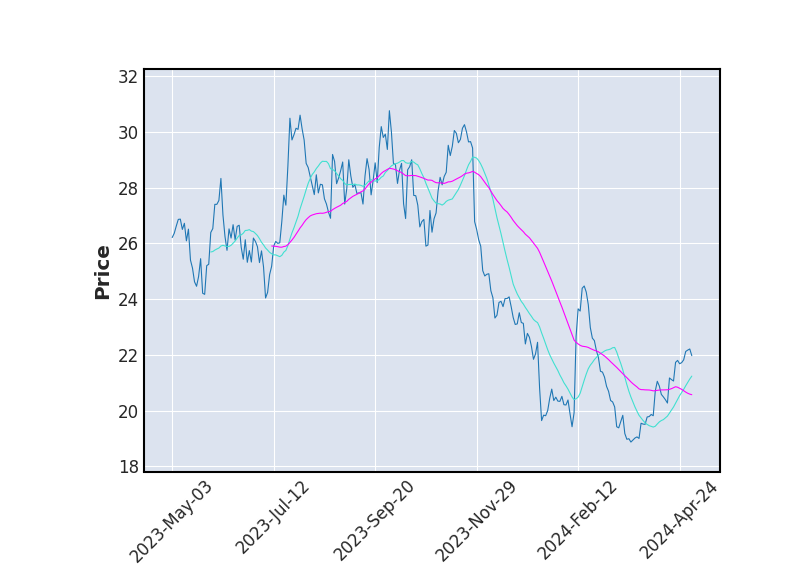 Moyenne Mobile
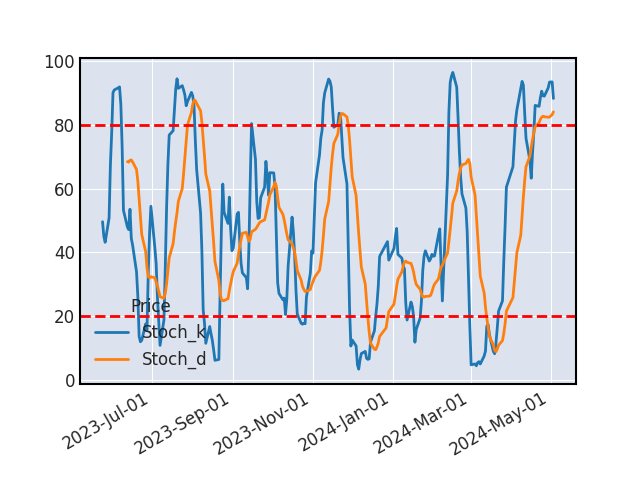 Stochastique
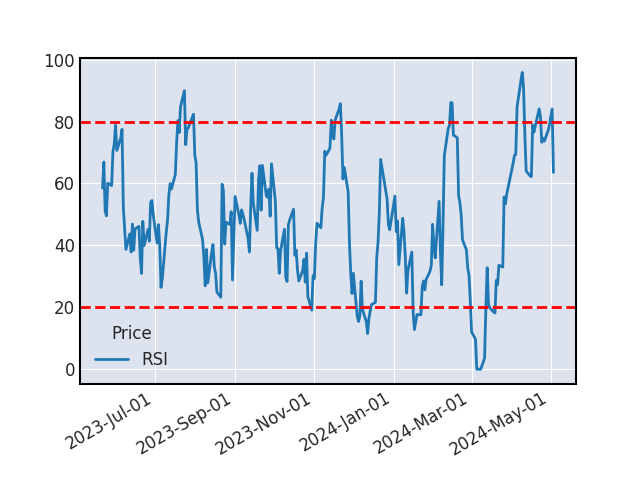 RSI
RSIAucun indicateur ne laisse présager d'une hausse ou d'une baisse à venir.
VOLUME
Les échanges sont très étoffés aujourd'hui, le mouvement est fort.
SUPPORTS ET RESISTANCES
| Support Résistance | Rebond | Ecart avec le cours |
|---|---|---|
| 6.02 | 4 | 27.35% |
| 4.7 | 5 | -0.62% |
Historique de cours - UBISOFT
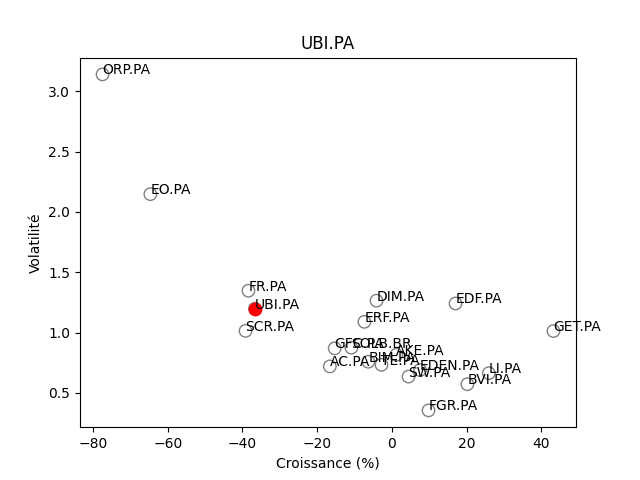
Positionnement boursier de UBISOFT

Version Beta