| Action | MMA | MACD_MME | Bollinger | Stochastique | RSI | Chandelier |
|---|---|---|---|---|---|---|
| ULTA BEAUTY | RAS | RAS | RAS | Neutre | Signal ↑↑↑ : 16.3% | Neutre | RAS |
ULTA BEAUTY : 534.81
| 1j | 5j | 1m | 3m | 1a |
|---|---|---|---|---|
| 1.14% | 0% | 0% | 0% | 6.38% |
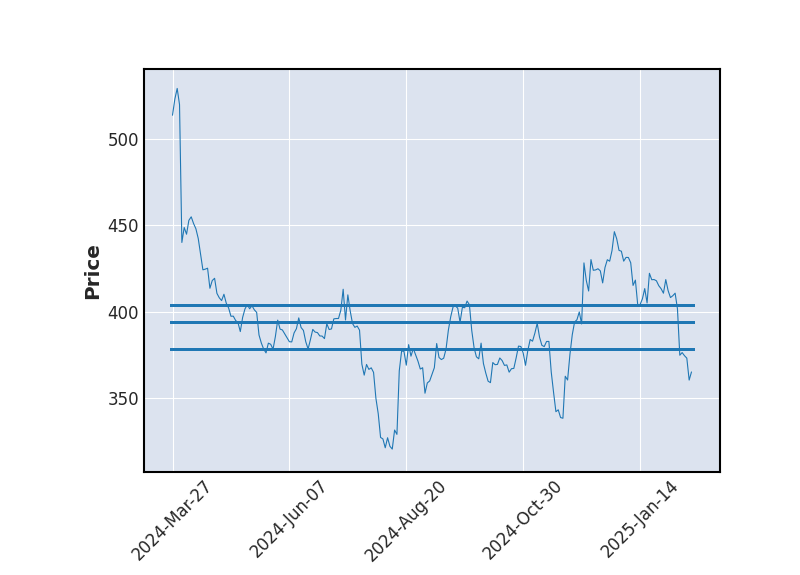
Evolution annuelle
Min : 486.25Moy : 517.71Max : 539
|
534.81
| Court terme | Moyen terme | Long terme |
|---|---|---|
 | | |


Analyse Boursicot du 18/09/2025
Graphique boursier
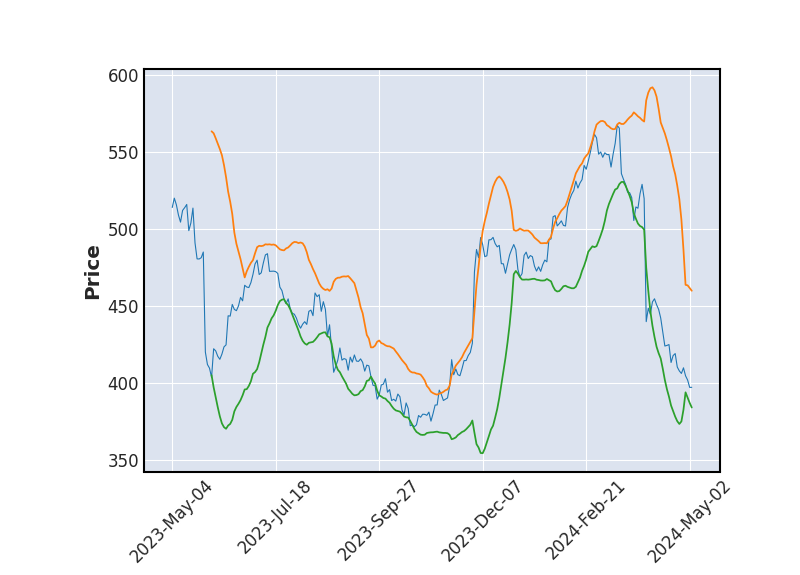 Bollinger
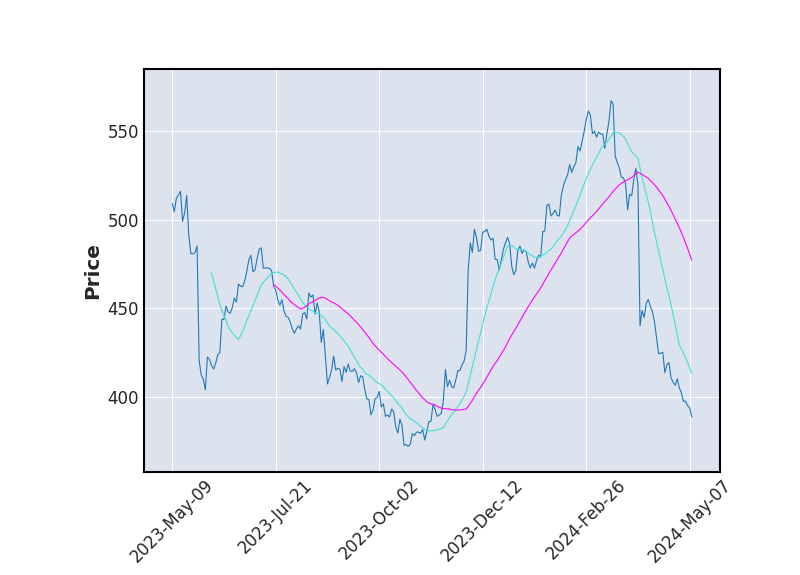 Moyenne Mobile
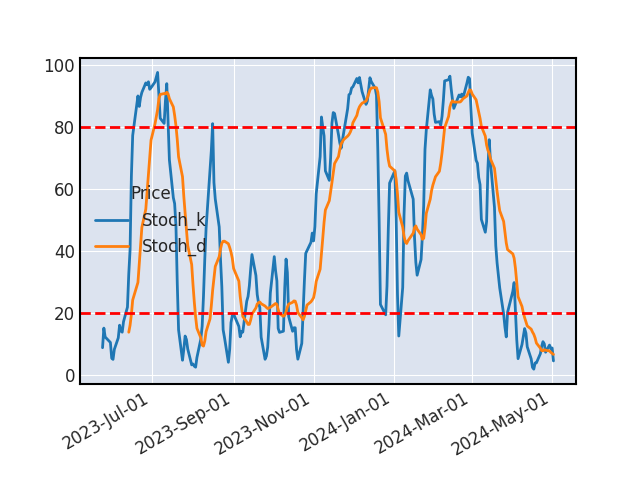 Stochastique
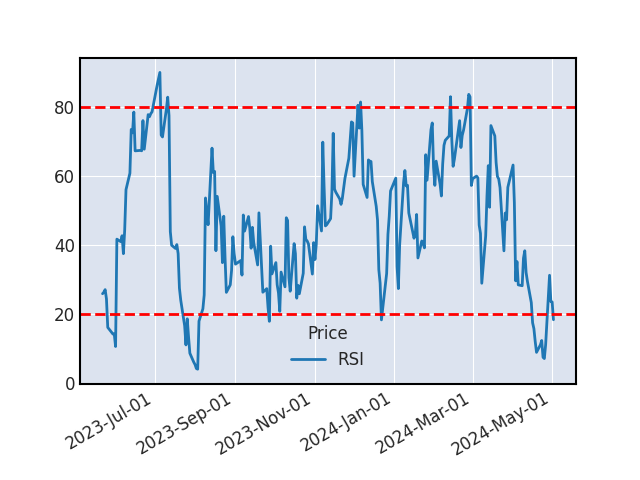 RSI
RSISTOCHASTIQUE
Le stochastique et son signal se sont croisés, en cas de confirmation par un autre indicateur, ce signal nous indique une hausse à venir du cours.
VOLUME
Les volumes échangés sur le titre ULTA BEAUTY sont particulièrement faible aujourdhui (plus de 50% au-dessous de la moyenne).
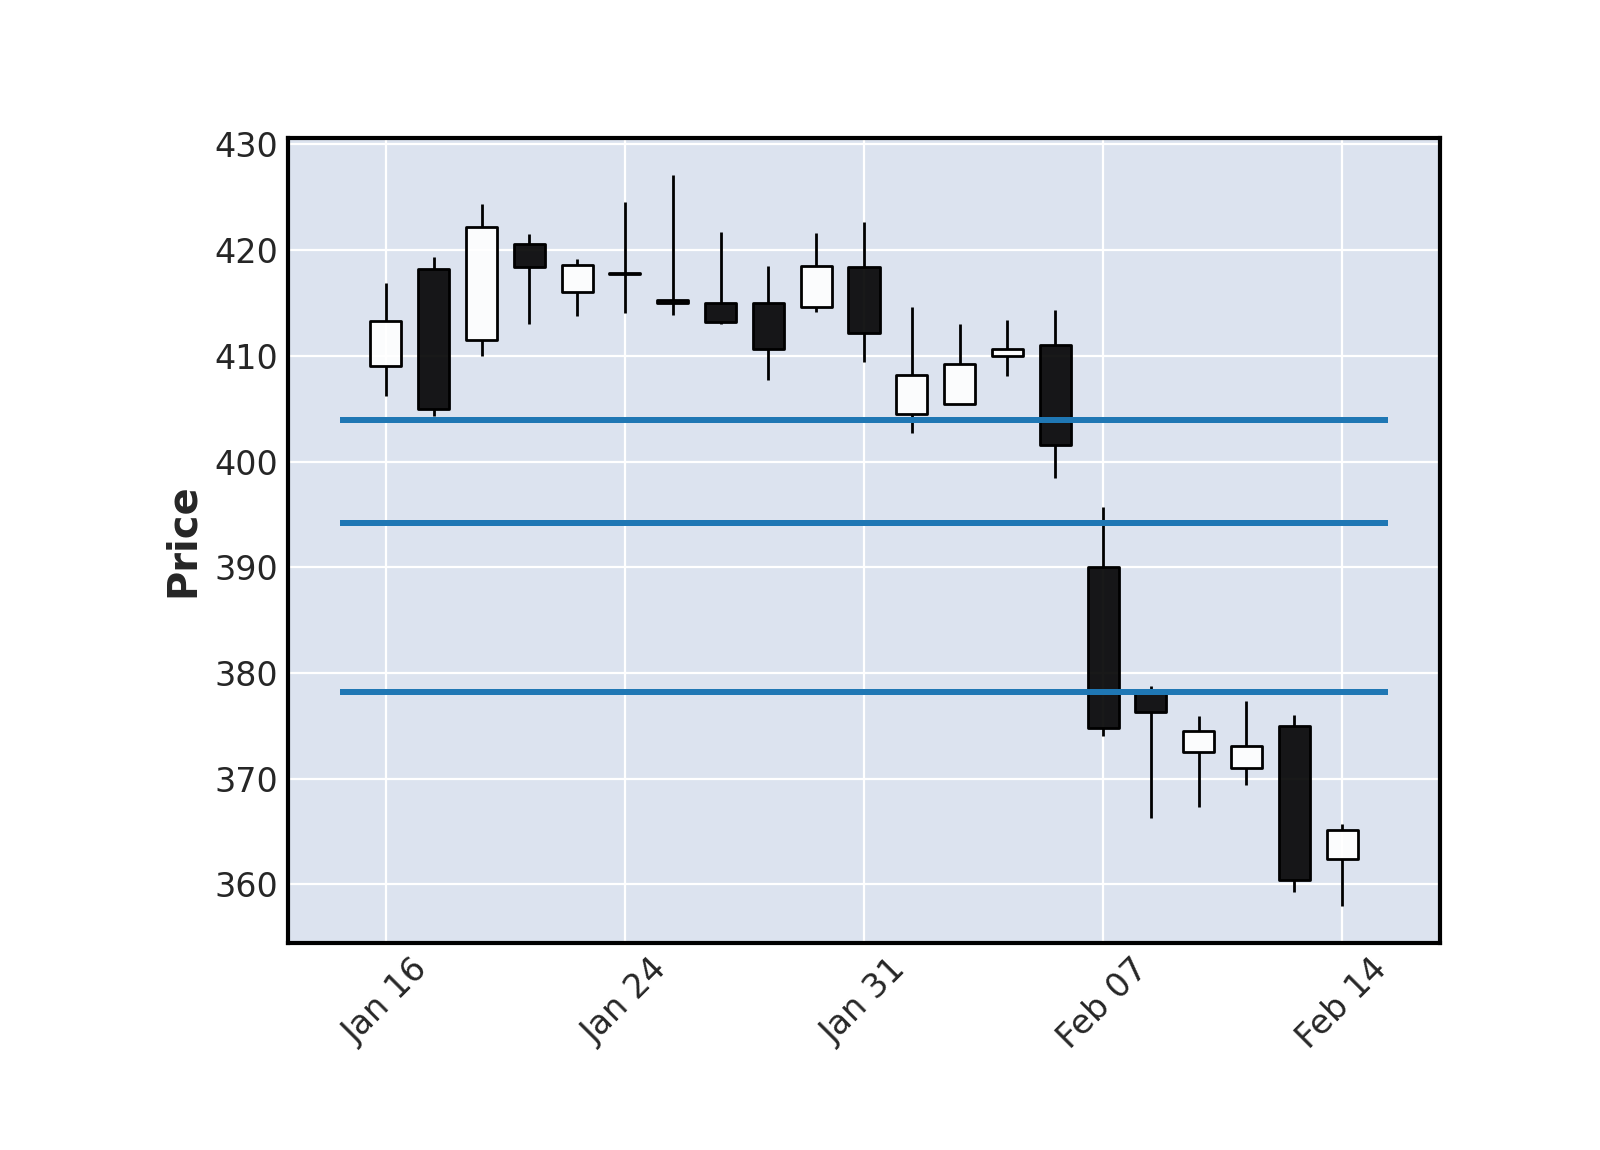
SUPPORTS ET RESISTANCES
| Support Résistance | Rebond | Ecart avec le cours |
|---|---|---|
| 533.26 | 2 | -0.29% |
| 473.82 | 3 | -11.4% |
| 404.34 | 3 | -24.39% |
| 358.22 | 3 | -33.02% |
Historique de cours - ULTA BEAUTY
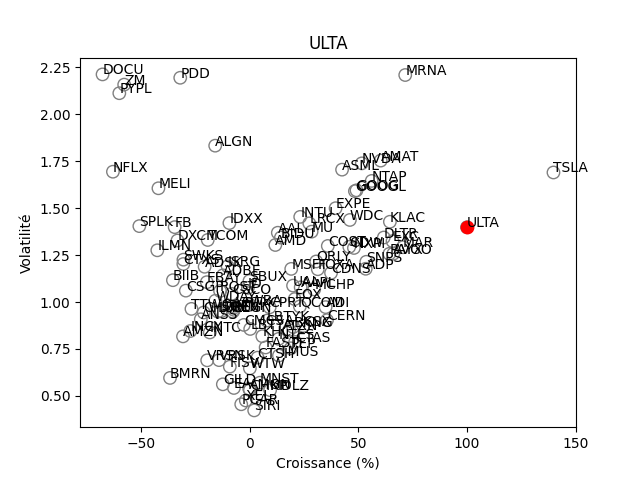
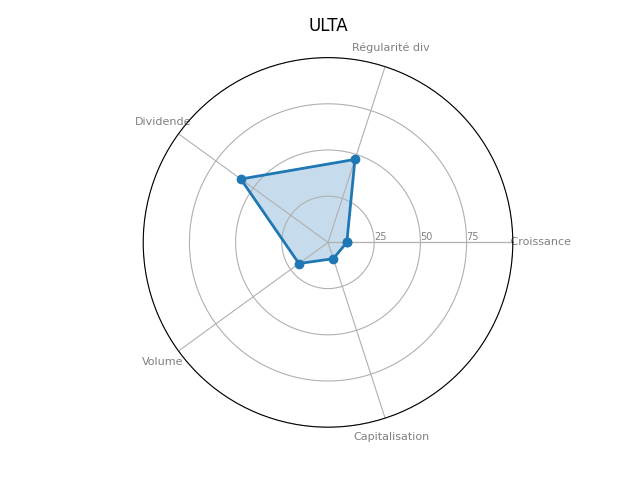
Positionnement boursier de ULTA BEAUTY
Version Beta