| Action | MMA | MACD_MME | Bollinger | Stochastique | RSI | Chandelier |
|---|---|---|---|---|---|---|
| VERISIGN | Signal ↑↑ : 0.0035% | RAS | RAS | Neutre | RAS | Sur-achat↓ | RAS |
VERISIGN : 285.88
| 1j | 5j | 1m | 3m | 1a |
|---|---|---|---|---|
| -0.66% | 0% | 0% | 0% | 0.94% |
Evolution annuelle
Min : 261.23Moy : 279.23Max : 310.6
|
285.88
| Court terme | Moyen terme | Long terme |
|---|---|---|
 |  | |


Analyse Boursicot du 18/09/2025
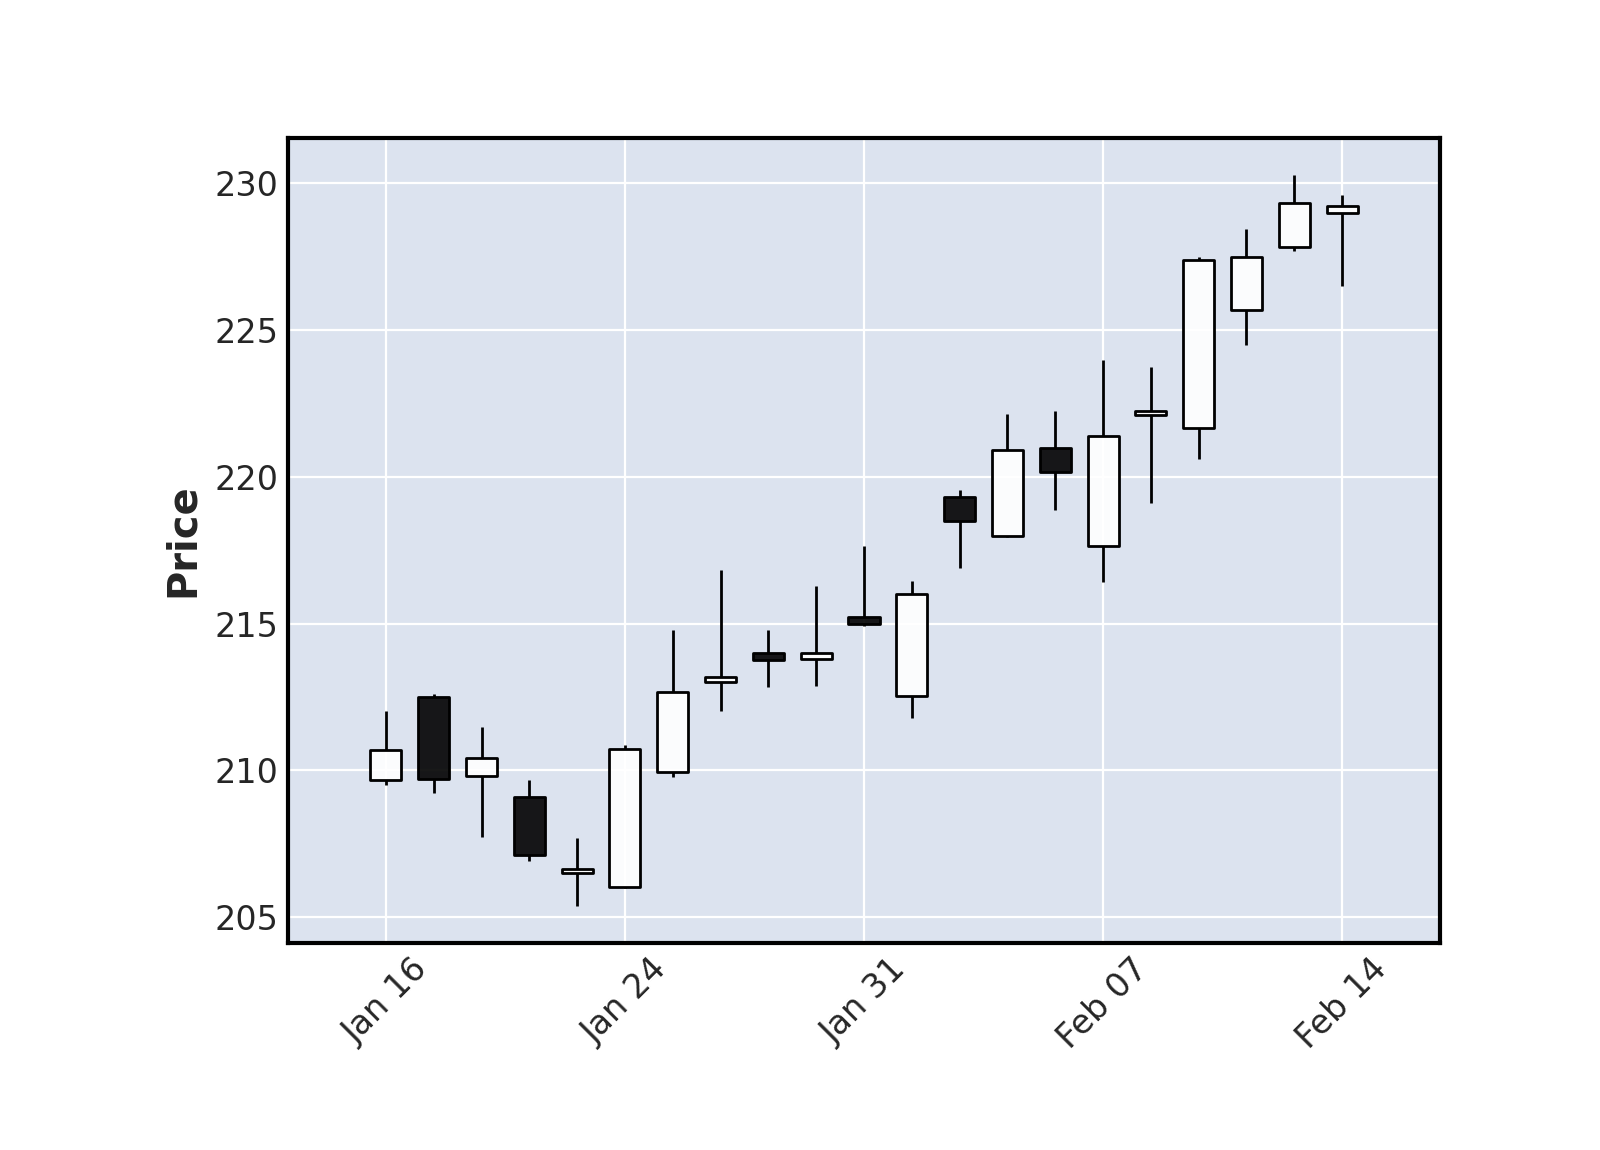
Graphique boursier
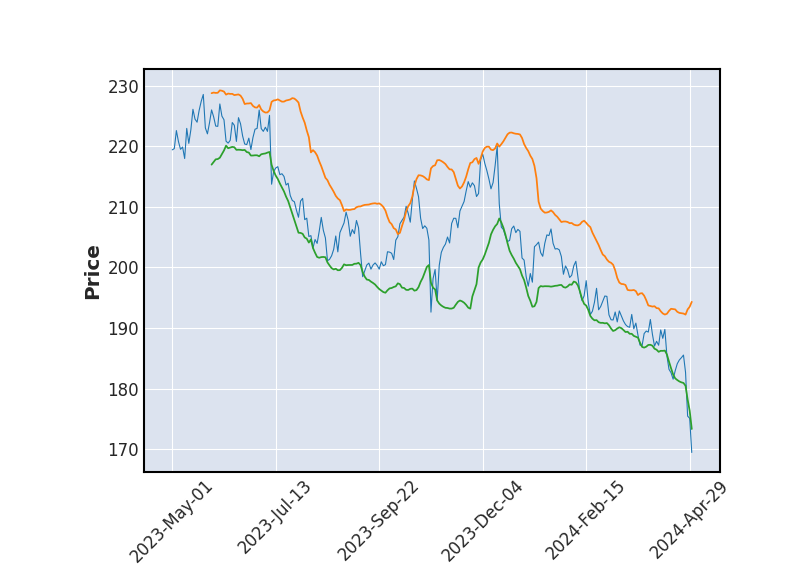 Bollinger
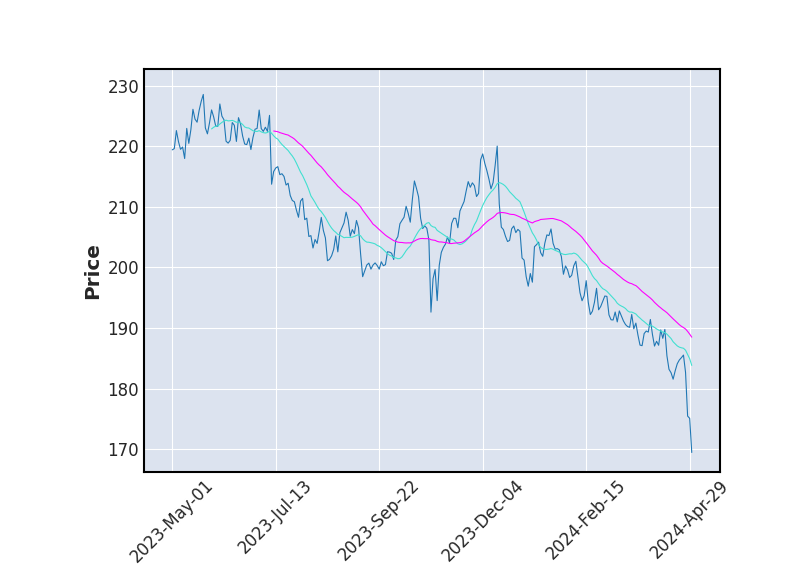 Moyenne Mobile
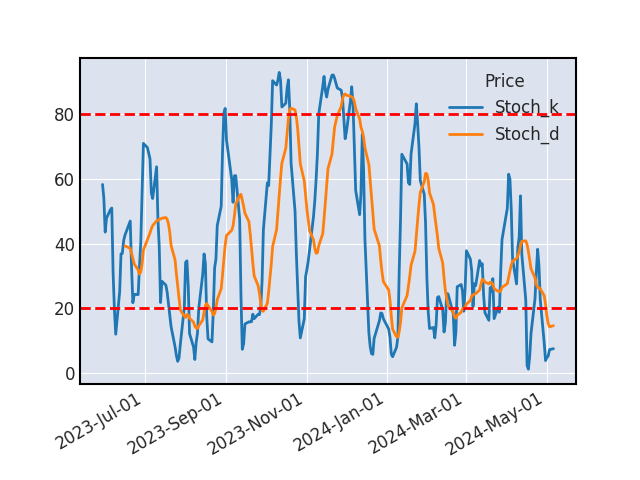 Stochastique
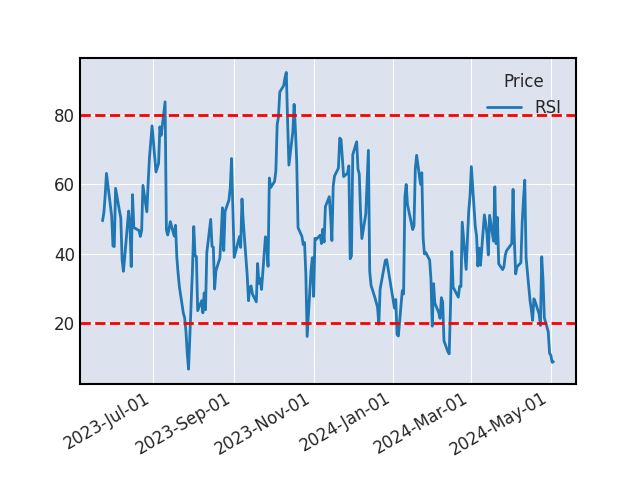 RSI
RSIMMA
L'action VERISIGN semble se diriger vers une nouvelle hausse suite à la confirmation du signal haussier (croissement des MMA 20 et 50).
RSI
L’indicateur RSI du titre vient de passer sous les 80 après être passé dans la zone du sur-achat. Le titre devrait engager une phase de baisse sur les prochaines séances.
L'analyse des différents indicateurs ne permet pas de trancher, il conviendra d'attendre un signal clair.
SUPPORTS ET RESISTANCES
| Support Résistance | Rebond | Ecart avec le cours |
|---|---|---|
| 284.63 | 7 | -0.44% |
| 264.93 | 4 | -7.33% |
Historique de cours - VERISIGN

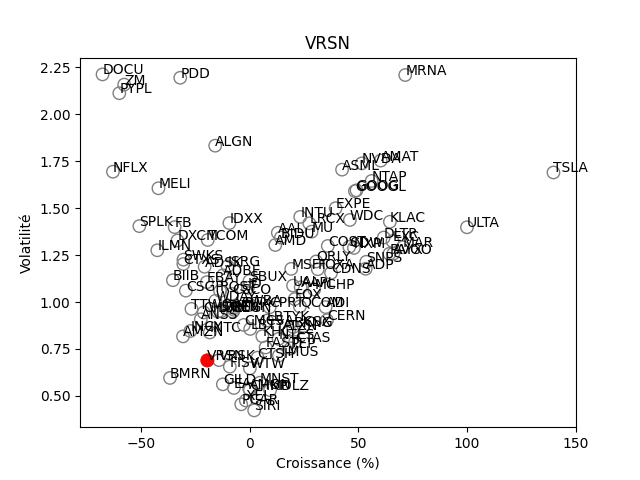
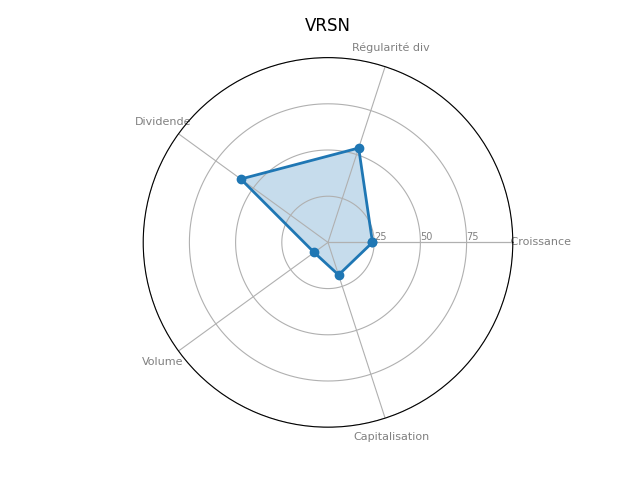
Positionnement boursier de VERISIGN
Version Beta