| Action | MMA | MACD_MME | Bollinger | Stochastique | RSI | Chandelier |
|---|---|---|---|---|---|---|
| AMUNDI MSCI EM ASIA UCITS ETF-C EUR | RAS | RAS | RAS | Neutre | Signal ↓↓ : -7.54% | Neutre | RAS |
AMUNDI MSCI EM ASIA UCITS ETF-C EUR : 59.3
| 1j | 5j | 1m | 3m | 1a |
|---|---|---|---|---|
| -1.77% | -1.15% | 0.2% | 28.61% | 51.47% |
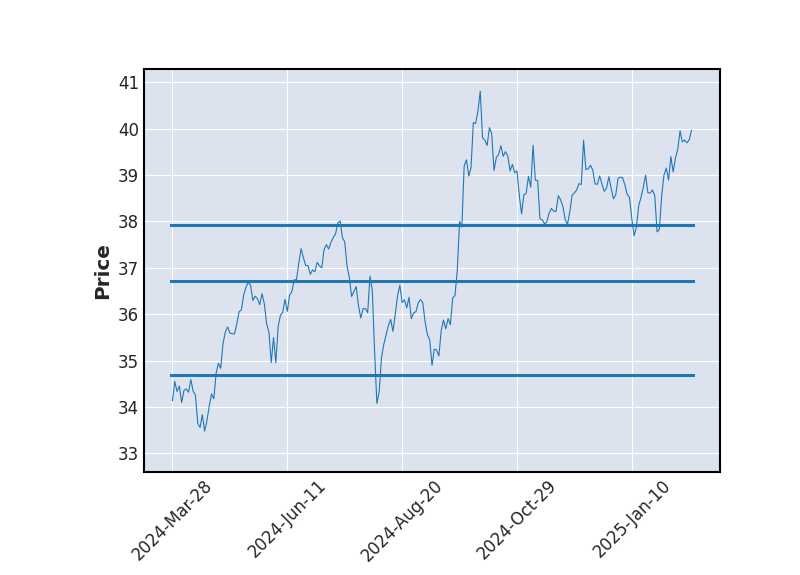
Evolution annuelle
Min : 38.98Moy : 47.45Max : 63.65
|
59.3
| Court terme | Moyen terme | Long terme |
|---|---|---|
 | | |


Analyse Boursicot du 26/06/2026
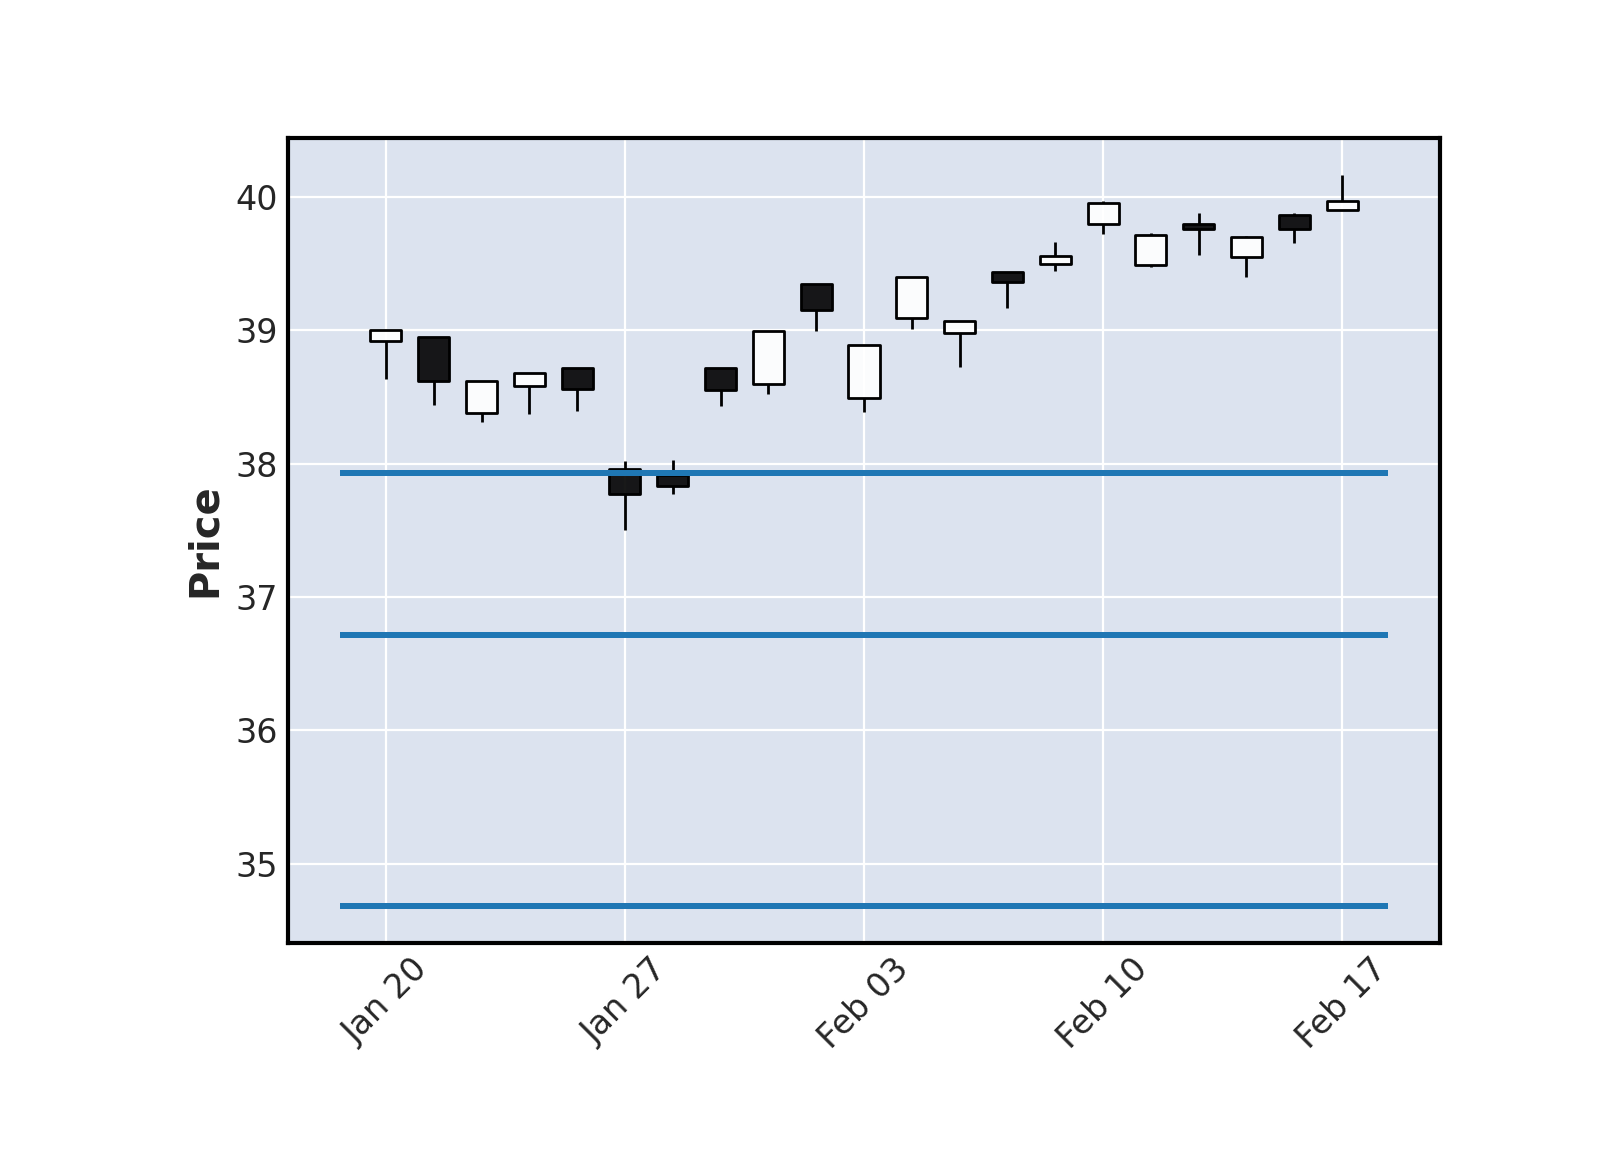
Graphique boursier
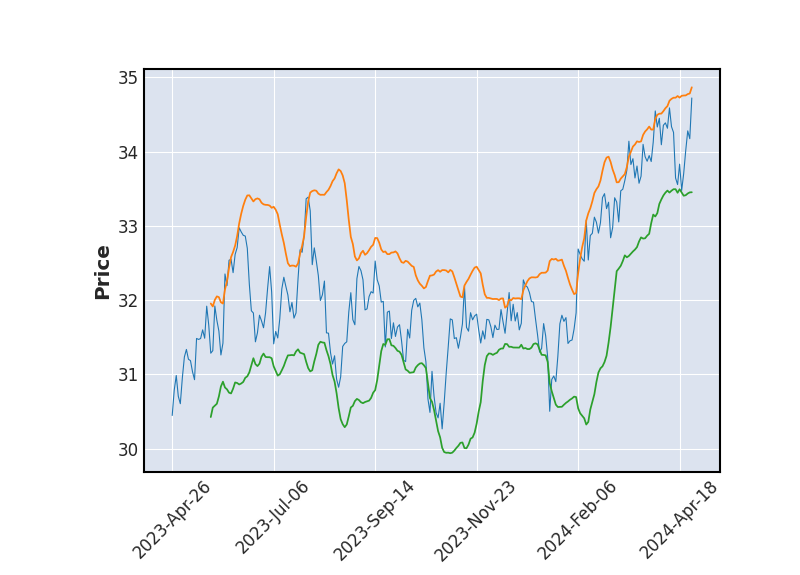 Bollinger
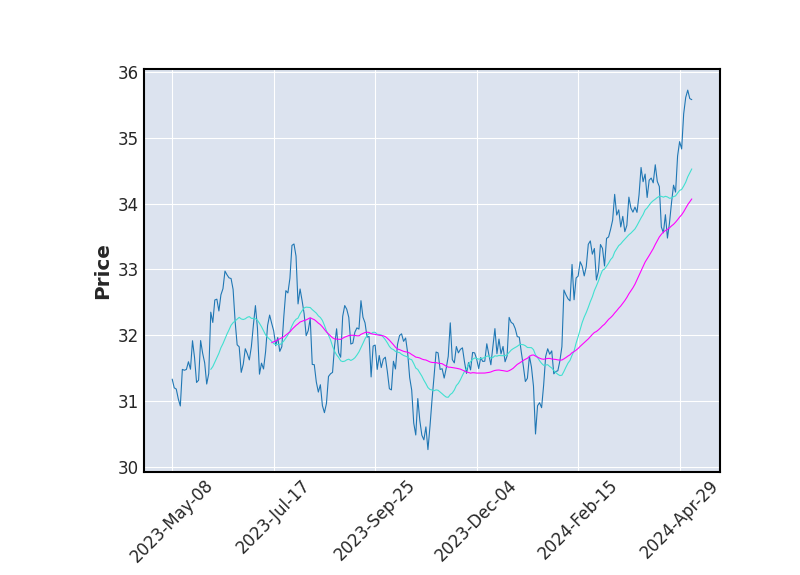 Moyenne Mobile
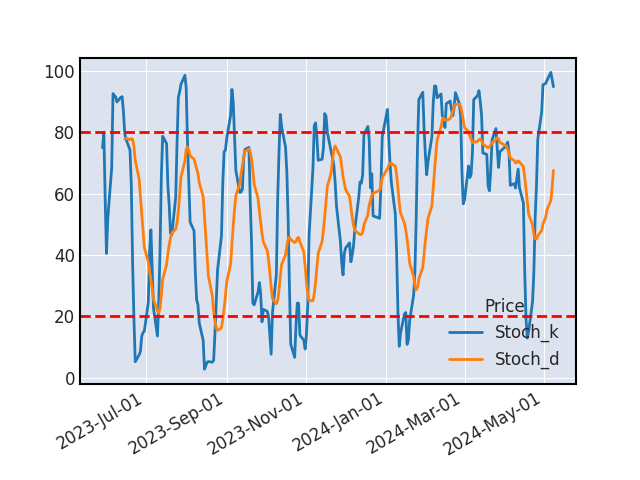 Stochastique
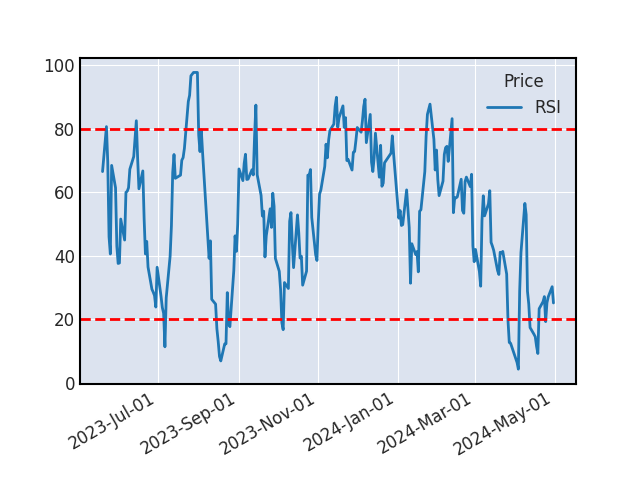 RSI
RSISTOCHASTIQUE
Le stochastique et son signal se sont croisés, en cas de confirmation par un autre indicateur, ce signal nous indique une baisse à venir du cours.
VOLUME
Les échanges sont très étoffés aujourd'hui, le mouvement est fort.
SUPPORTS ET RESISTANCES
| Support Résistance | Rebond | Ecart avec le cours |
|---|---|---|
| 47.75 | 3 | -19.47% |
| 44.62 | 4 | -24.75% |
| 43.39 | 3 | -26.83% |
| 40.87 | 5 | -31.08% |
Historique de cours - AMUNDI MSCI EM ASIA UCITS ETF-C EUR
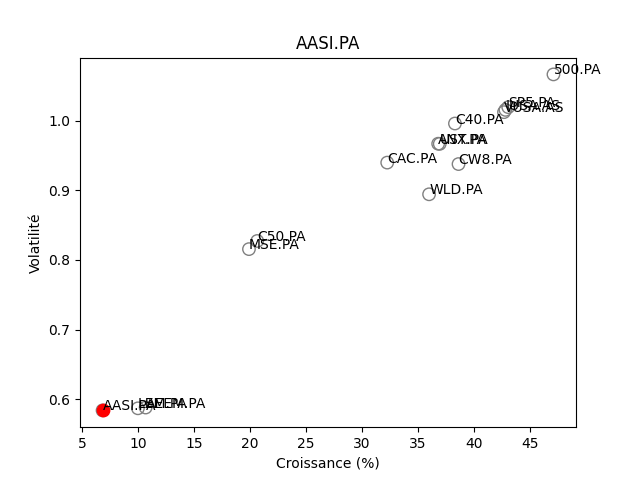
Positionnement boursier de AMUNDI MSCI EM ASIA UCITS ETF-C EUR

Version Beta