| Action | MMA | MACD_MME | Bollinger | Stochastique | RSI | Chandelier |
|---|---|---|---|---|---|---|
| AMUNDI EURO STOXX 50 UCITS ETF-C EUR | RAS | RAS | RAS | Neutre | RAS | Neutre | RAS |
AMUNDI EURO STOXX 50 UCITS ETF-C EUR : 167.14
| 1j | 5j | 1m | 3m | 1a |
|---|---|---|---|---|
| -1.21% | -0.96% | 1.85% | 12.25% | 22.18% |
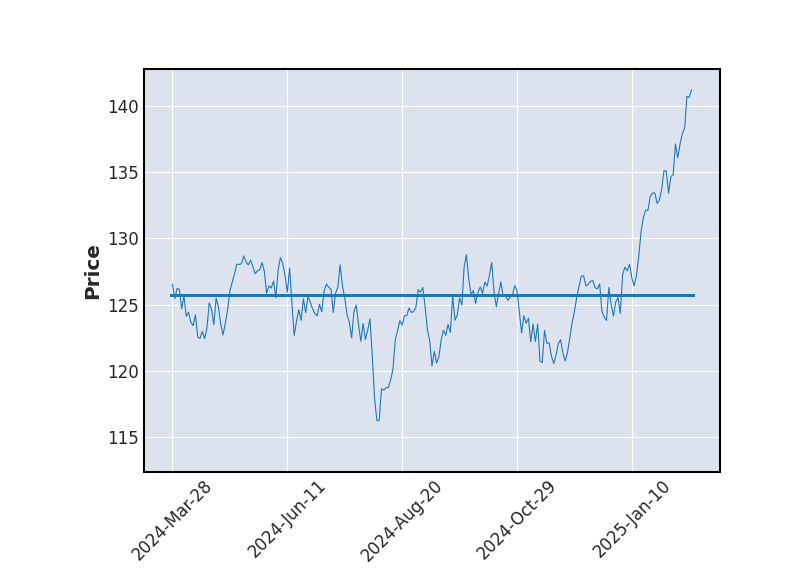
Evolution annuelle
Min : 134.68Moy : 150.49Max : 169.9
|
167.14
| Court terme | Moyen terme | Long terme |
|---|---|---|
 | | |


Analyse Boursicot du 23/06/2026
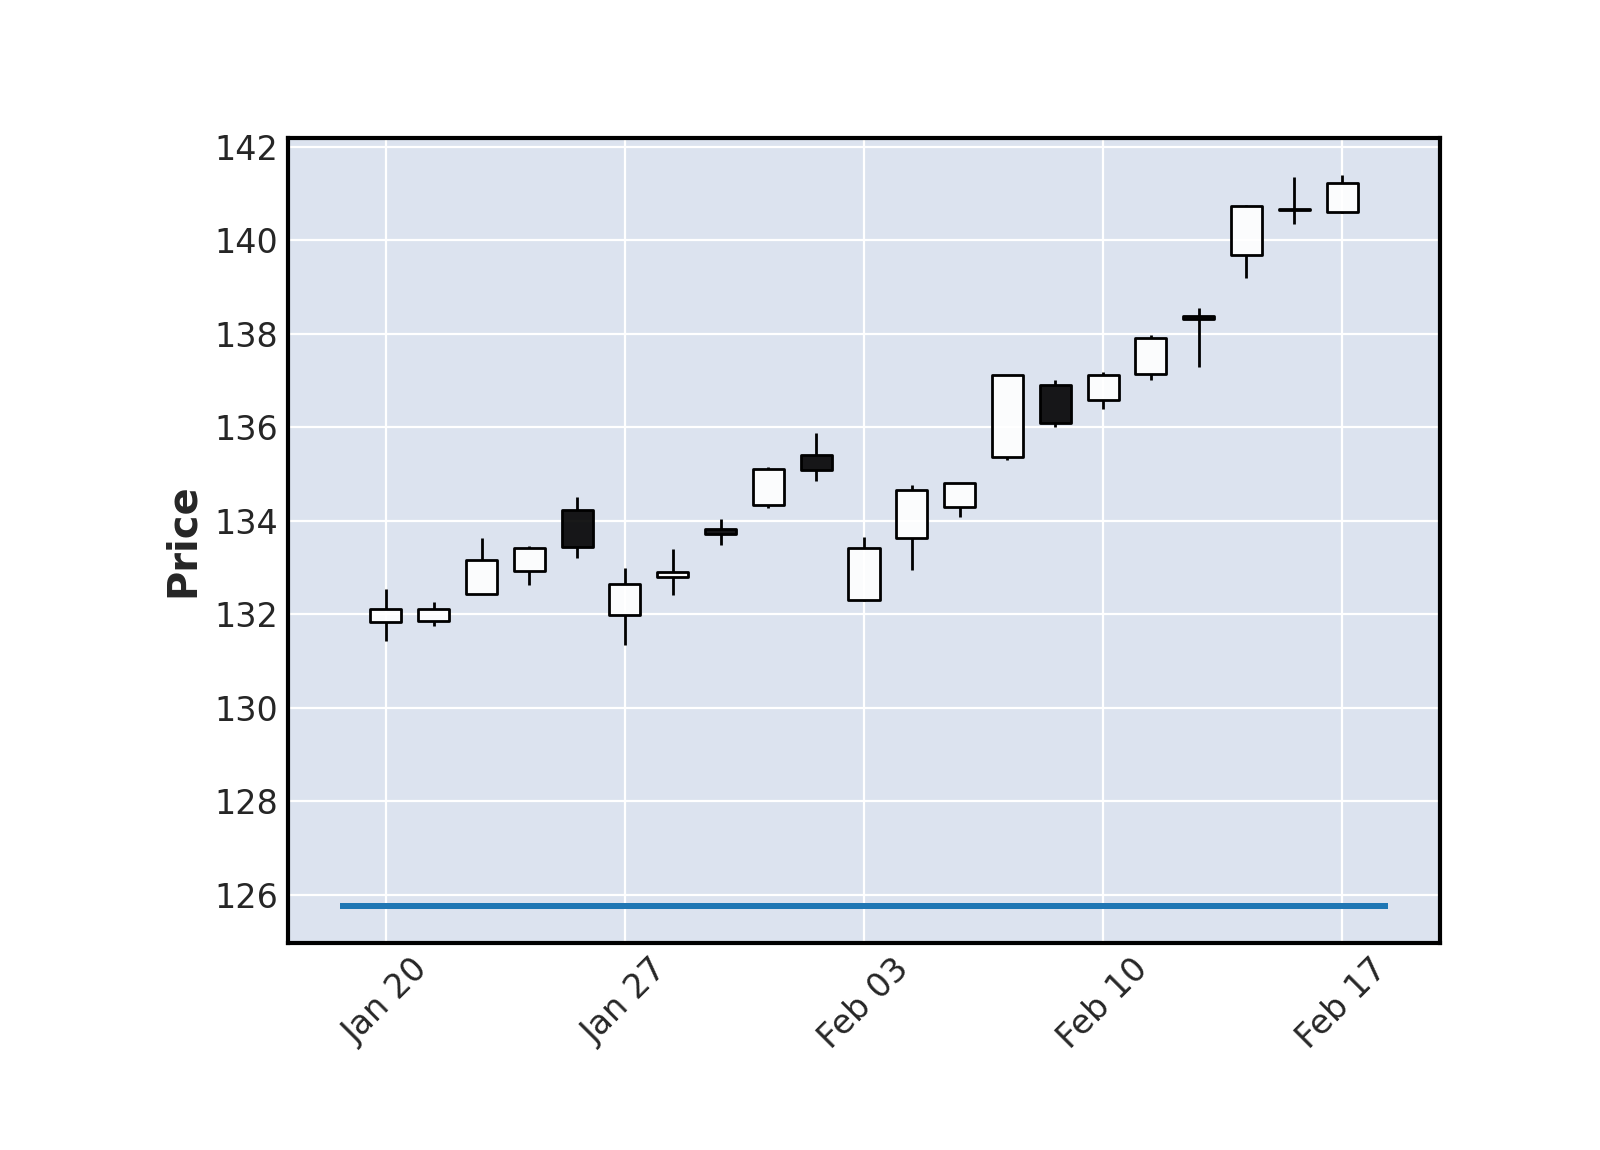
Graphique boursier
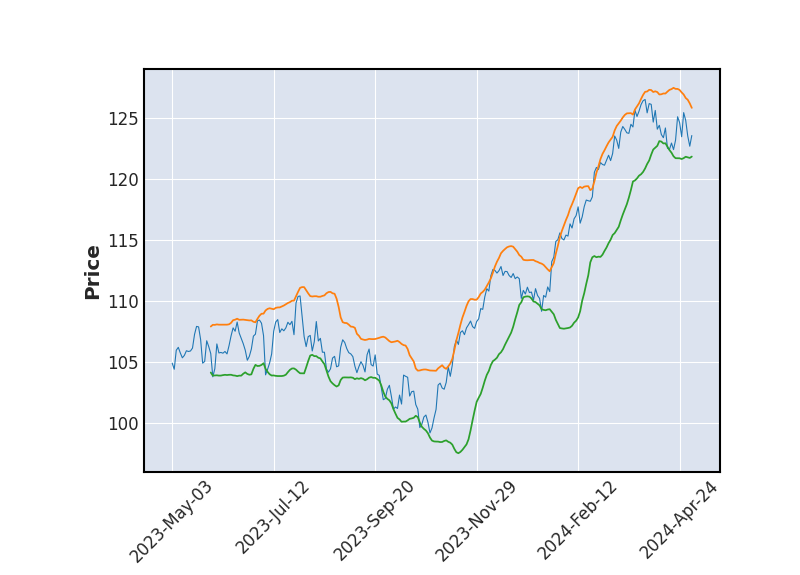 Bollinger
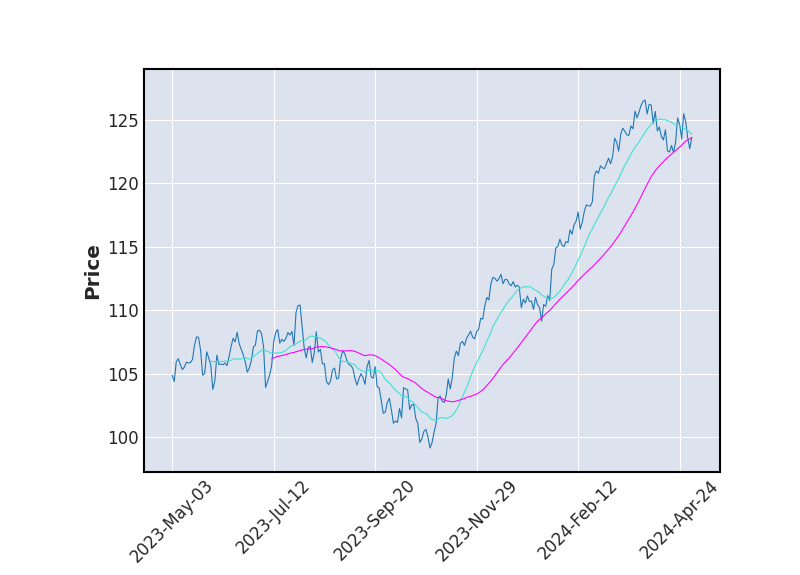 Moyenne Mobile
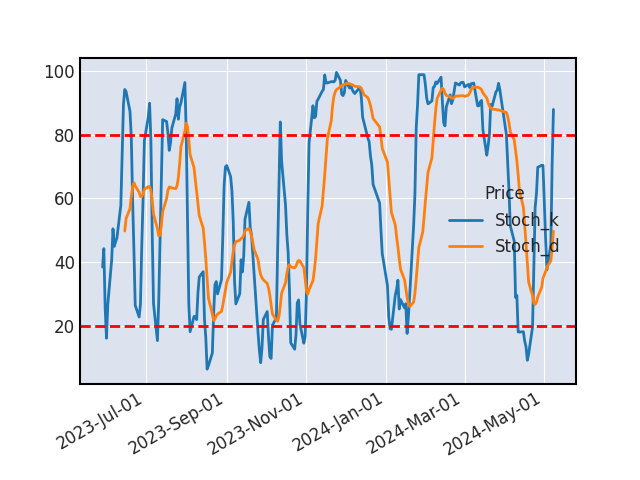 Stochastique
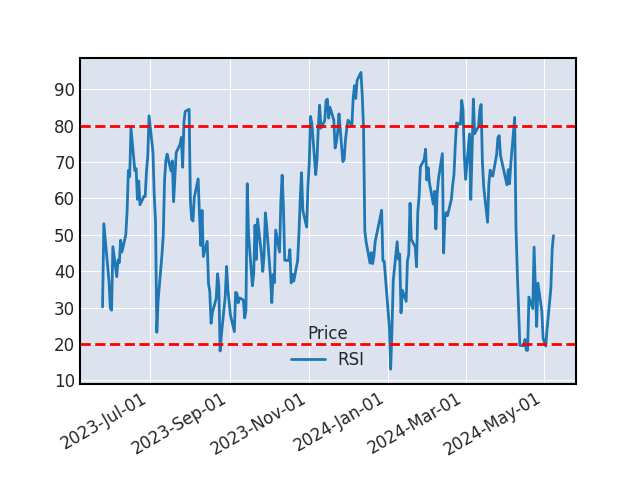 RSI
RSIL'analyse technique n'a pas permis d'identifier d'évolution à la hausse ou à la baisse.
SUPPORTS ET RESISTANCES
| Support Résistance | Rebond | Ecart avec le cours |
|---|---|---|
| 160.91 | 10 | -3.73% |
| 154.78 | 3 | -7.39% |
| 148.99 | 4 | -10.86% |
| 143.53 | 7 | -14.12% |
Historique de cours - AMUNDI EURO STOXX 50 UCITS ETF-C EUR
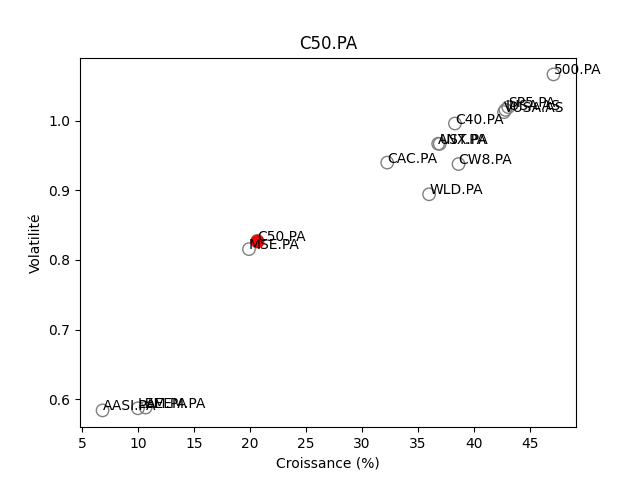
Positionnement boursier de AMUNDI EURO STOXX 50 UCITS ETF-C EUR

Version Beta